Where to invest in Retail? Find out in Knight Frank's top 200 retail rankings
Big and busy is best? Geographic comfort of London and the South East? An affluent catchment? An isolated town with limited competition? A picturesque centre that presents well?
3 minutes to read
All considerations that invariably drive sentiment in high street investment decisions, but rarely transcend the subjective.
Investment decisions need to be much more quantifiable than the mere eye of the beholder.
Cue Knight Frank’s bespoke High Street Investment Ranking. There’s nothing like a retail ranking to provoke media interest, spark bragging rights debates and generally stir up the hornets’ nest (and there’s always as much interest in wallowing at the bottom, as focussing on the top).
Producing retail rankings is a well-trodden path, with the likes of CACI (Retail Footprint), Javelin (Venuescore) and PMA (PROMIS) all having a strong track record in deciphering national retailing hierarchies.
All these rankings carry merit and are rightly used across the retail occupier and investment industries. Our aim is to complement other mainstream rankings, rather than supplant them. How is Knight Frank’s Ranking different?
- 1. It is tailored to the retail property investment community – what constitutes a good town centre or high street to invest into
- 2. It is forward looking – where possible, to major on forecast variables and datasets to give a view as to where a centre is going, as opposed to where it is now or has come from.
Other retail rankings tend to rate the relative quality of a town’s overall retail proposition based upon the presence of key retailers in that centre.
Others are based on estimates of the gravitated comparison goods spend that is made in each The data has been collated for each variable on each of the 200 centres.
Each centre is then scored relative to all the other centres on every variable. The top 10 centres on each variable are allocated 20 points, those ranking 11-20, 19 points and so on (the bottom 10 centres a single point).
We have also applied selected weightings to reflect the relative importance of certain variables. For example, we have upweighted most of the forward-looking variables and forecasts, in keeping with our aim of looking more to the future than the past. Others with degree of overlap or possible double-counting have been selectively downweighted.
Each centre is allocated an Overall Score, the cumulative total of the scores it achieves across the 20 variables (with weightings applied).
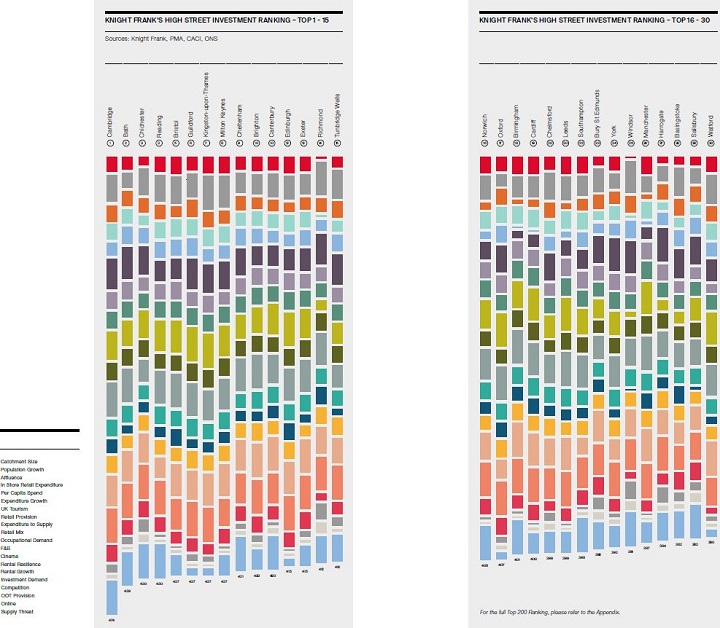
The Top 30
The Top 30 are listed below for the full Top 200, please download Issue 7 of the report. For the benefits of transparency, we have applied a 'stacked bar' system to all the variables as an indication of the relative strengths and weaknesses of that town relative to the rest of the PROMIS 200.
In simple terms, the larger the bar, the higher the score on that particular variable.
So, for example, those centres with the largest catchment population (e.g. Manchester, Leeds) have a larger bar than those in the Top 30 with the lowest (e.g. Richmond, Harrogate). For variables such as competition rank, those with the lowest level (e.g. Bury St Edmunds, Salisbury, Basingstoke) achieve the highest score and, accordingly, the largest bar.
Click to enlarge