The flying dealmakers, house price gravity and we measure London's walkability
Making sense of the latest trends in property and economics from around the globe
4 minutes to read
House prices
UK house prices climbed 0.3% in January, the smallest monthly increase since June 2021, according to the latest Halifax house price index.
We'll likely experience some volatility over the coming months due to low levels of supply, but a slowing in the rate of growth is inevitable over the course of the year when you consider the cost of living squeeze and rising interest rates. The average home now stands at £276,759, up around £24,500 on this time last year and £37,500 higher than it was two years ago.
Still, although growth will slow, momentum will remain resilient until the supply of housing improves relative to demand. The number of valuations conducted by Knight Frank during January, a leading indicator of supply, was up 6% in January compared to the five year average. That's all well and good, but the number of new applicants registering, a leading indicator of demand, was up 54% on the five year average.
We're seeing similar patterns in Prime Central London. The latest index, out today, reveals that the shelves are re-stocking at a relatively normal pace for the time of year, but demand remains unrelenting - an imbalance that could be exacerbated by the arrival of more overseas buyers. Average prices in the year to January grew by 1.5% in prime central London, the highest annual rate since August 2015. In prime outer London, average prices increased 3.5%, the largest annual growth since June 2015.
Rents
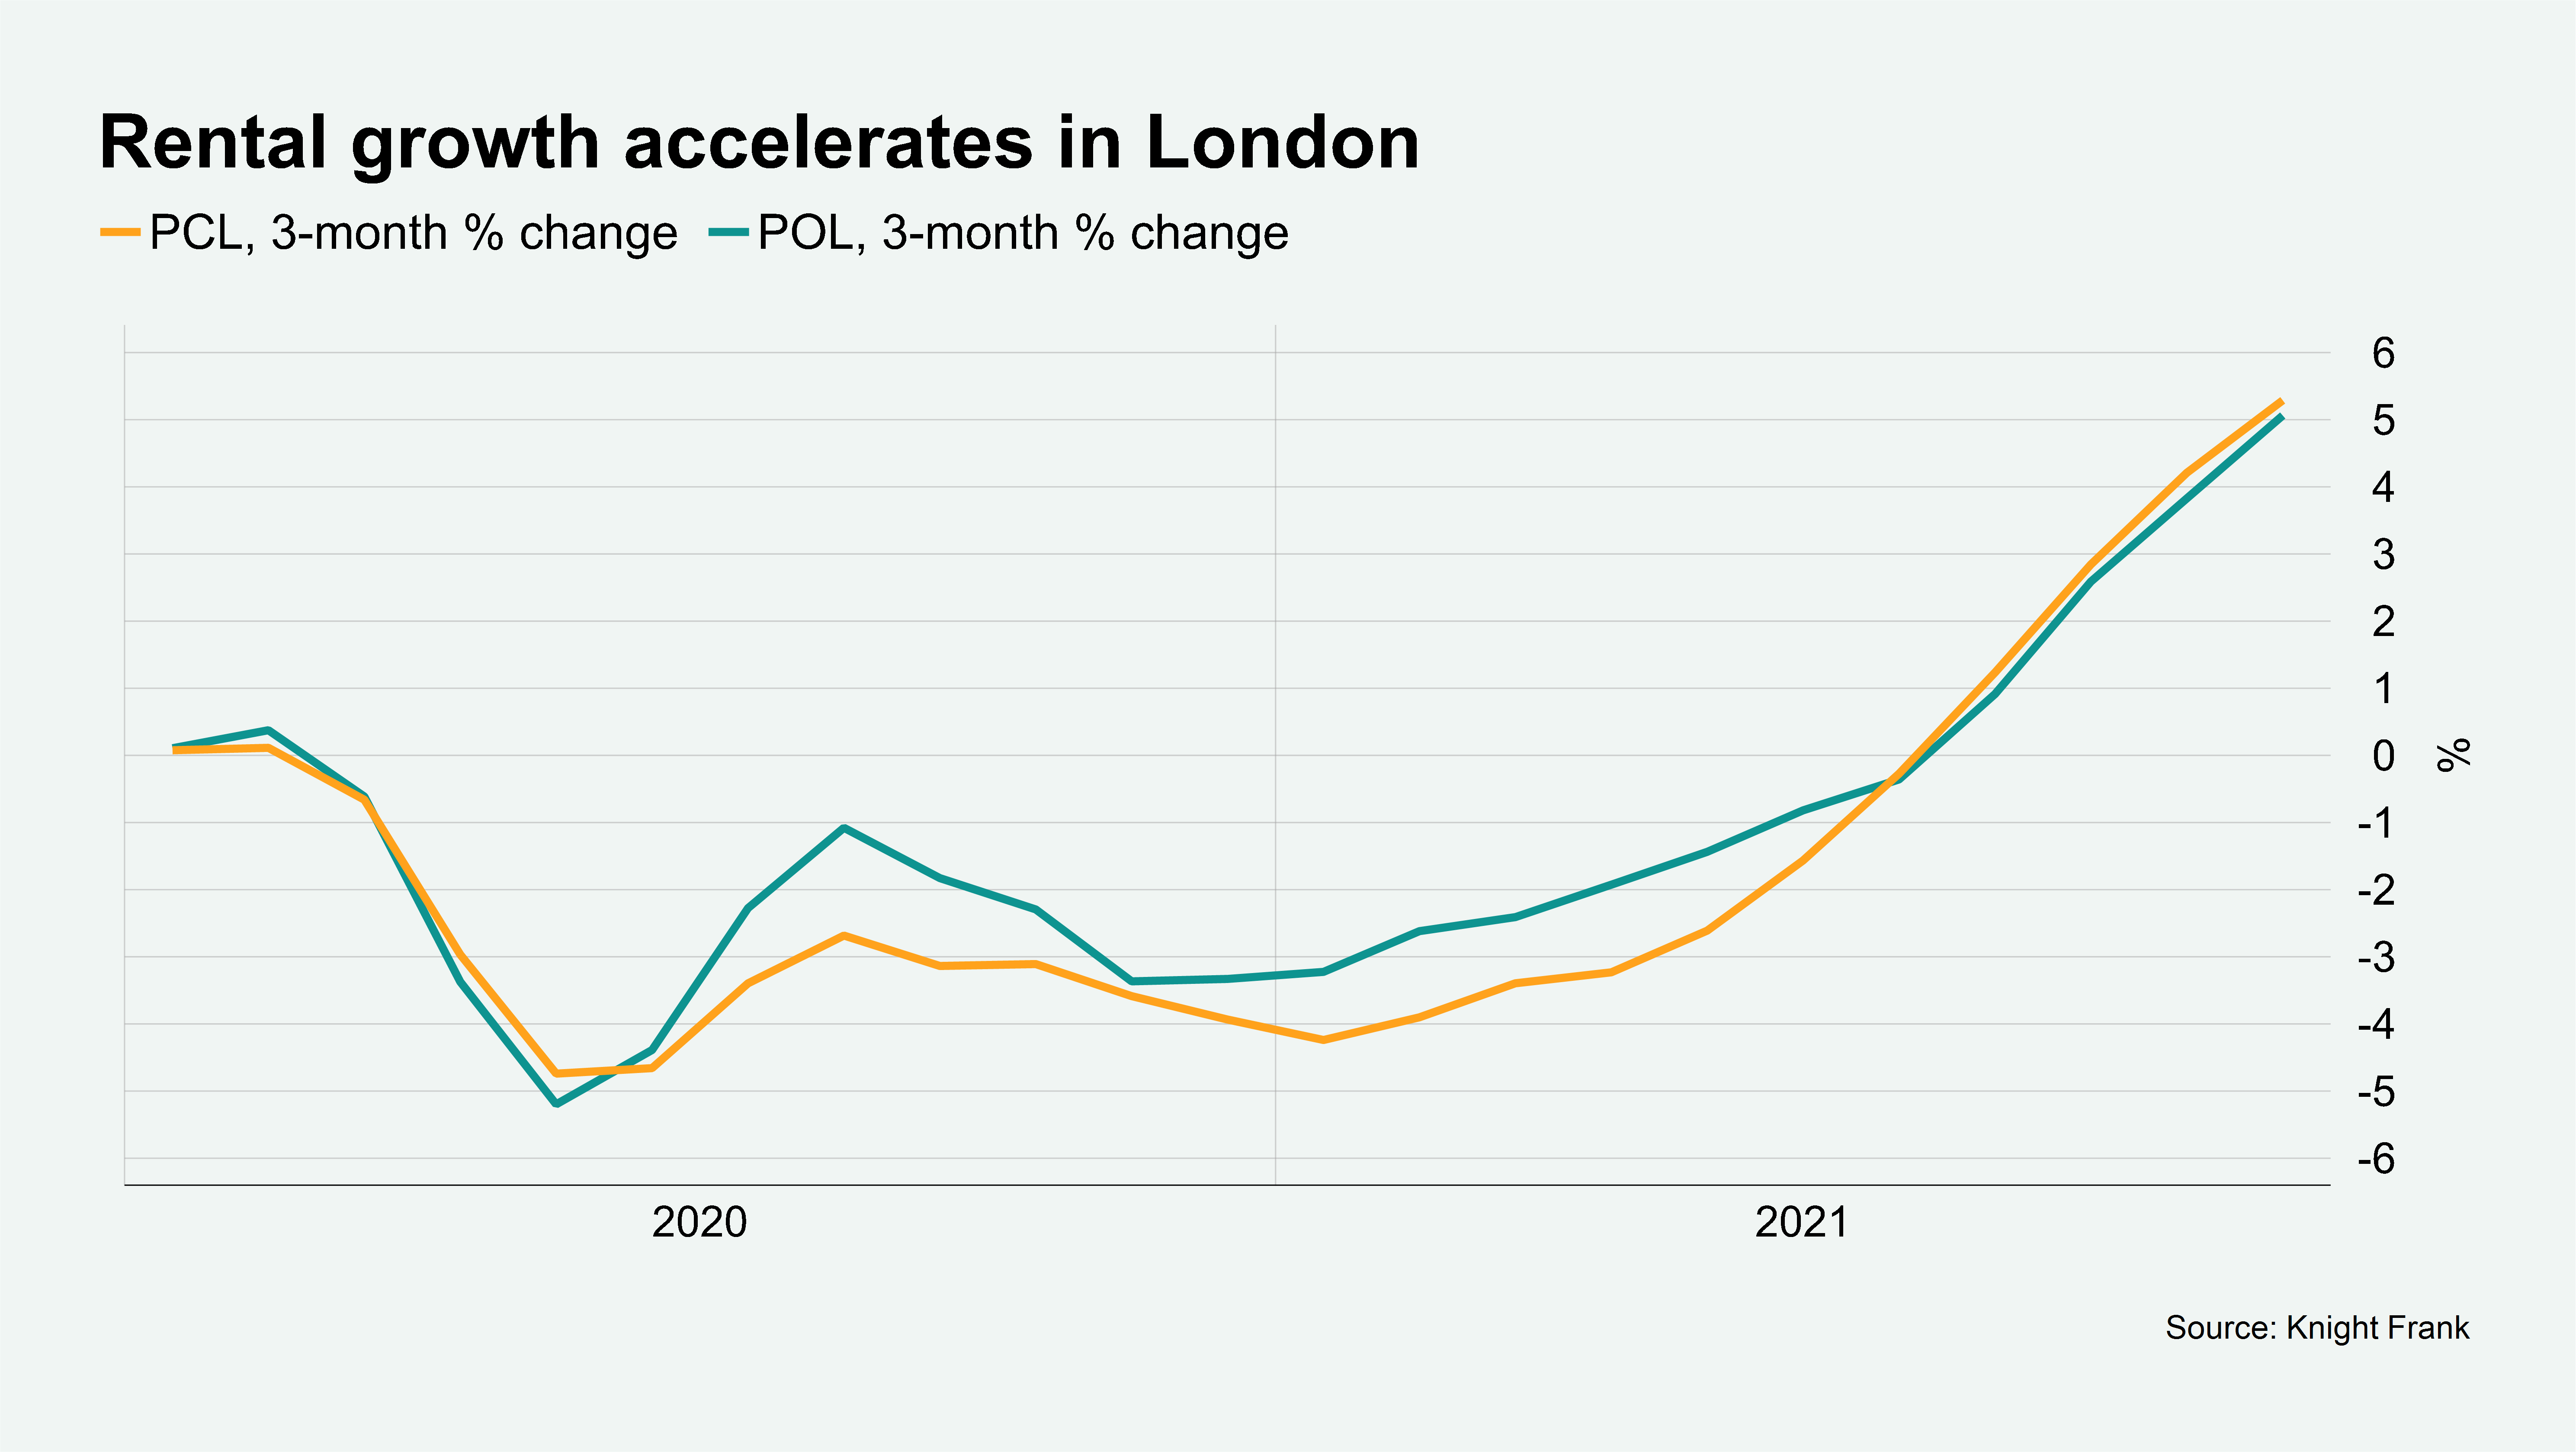
Rental values in London and the Home Counties climbed to 5% above their pre-pandemic level in March 2020.
The annual change in prime central London rents reached 19.8% in January, which was the largest jump since the index began in 1995. In prime outer London, the change was 16.6%, the largest increase over the same period.
Rental values in PCL fell 14.3% in the year to March 2021 as a flood of short-let properties hit the market and demand dried up. The situation reversed as lockdown restrictions were relaxed, producing the dramatic reversal – see revised chart below and tables in the full analysis, which you can find here.
Walkability
The pandemic has strengthened our desire to live closer to the amenities we value. When we asked London buyers what they believed was most important when choosing somewhere to live, nearly two thirds said that being close to local amenities is more important now than pre-pandemic. Some 34% said the same about being within walking distance to work.
The team explores these themes in greater depth in The London Report 2022. The report includes results from the Knight Frank Walkability Index, which has been developed to provide insight into the current built environment. Applying it to seven central London office sub-markets, the index analysis more than 140,000 Ordnance Survey address points and identifies 9,000 amenities of interest for walkability.
In isolation, London’s existing sub-markets score well for walkability. Overall, the West End Core tops our analysis, followed by the City Core, Southbank and Canary Wharf. However, often these high scores are underpinned by a dominance of a single sub-category. Further analysis of the West End Core, for example, shows that retail accounts for 70% of its total walkability score.
In comparison, other sub-markets including the Southbank boast a more balanced mix. Perhaps unsurprisingly, these are also the markets which have a higher number of homes. The top two, more mature submarkets for residential population have also seen office rental growth at twice the average of the wider market. Moreover, both submarkets maintain below average levels of availability, have seen substantial gains in property values and show greater resilience in economic downturns.
The flying dealmakers
Last year was a big year for dealmakers. Global M&A hit a record, so did global IPOs and the market for private jet travel is booming.
New data from WingX reveals January 2022 was the busiest start to the year on record for global business aviation activity. Compared to locked-down January 2021, business jet sectors were up by 35%. Compared to January 2019, which was as busy as any January in the previous decade, activity was up 15%.
Wealthy travellers are prepared to pay a big premium for the flexibility and autonomy offered by private jet operators and part of the boom lies with fact mainstream operators have suffered so much disruption during the pandemic. For many businesses, it shows there's still no equivalent to face-to-face deal making, though how much of a read across there will be to a recovery in more mainstream business travel remains unclear.
Business travel spend in the wider market will surge 37% next year to hit more than $1 trillion, though likely won't recover full until 2024, according to forecasts from the Global Business Travel Association.