Benchmark Land Value – fine margins
20 minutes to read
The consultation on reforms to the National Planning Policy Framework (NPPF) and other changes to the planning system is due to close later this month (24th September). One proposal within that consultation, reignited by the government’s proposed greybelt ‘golden rules’, surrounds the setting of indicative Benchmark Land Value (BLV) for land released from the Green Belt through national policy. Below, Charlie Dugdale, Head of Development Partnerships at Knight Frank, shares his thoughts on the practicalities, considerations and complications that may arise from such an approach in relation to urban extensions and new settlements.
Key takeaways
- There needs to a commercial return in every step of housing delivery. The relevant activities are land promotion, land development and housebuilding.
- Sites are stalling on viability grounds. If more development is the desired outcome then policy needs to acknowledge financial returns that are commensurate with the risks being taken.
- BLVs are a land promoter’s best estimate of a site’s value with planning permission and needs to be 20x EUV if land promotion is to be encouraged and if land development is to be viable.
- Every site has different characteristics that impact its viability, and therefore each site should be assessed on its individual merits. A fixed affordable housing threshold in any geography will reduce the overall quantum of affordable housing provided.
Experience
My personal experience relates directly to sustainable urban extensions (SUEs) and new settlements across a national geography. I have operated for 20 years in this sector and typically advise on projects of between 1,000 homes and 15,000 homes.
Whilst SUEs and new settlements are only a part of the marketplace, I believe some of the market dynamics affecting viability are more pronounced and perhaps therefore the importance of policy factors become more obvious than when related to smaller sites. The most notable difference that scale brings is the infrastructure costs required to enable the sites, and with size brings complexity and the need for a ‘land developer’ to service the land for home builders.
My experience includes greenbelt sites as well as non-greenbelt sites, and I see little difference between the two when it comes to incentivising market activity. The cost and risk of planning has historically been greater for greenbelt-release sites, but this should be normalised under the proposed greybelt policy proposals.
The cost of infrastructure may be just as high for greybelt sites as with new settlements, although there is also the greater possibility of greybelt sites benefitting from pre-existing infrastructure given their proximity to urban areas. We will explore this later, but the key conclusion is that the differences in pre-existing infrastructure can create significant disparities between the viability of different sites and requires that the viability of each site be considered on an individual basis.
BLVs or value with planning permission?
As market practitioners will appreciate, once a resolution to grant planning permission is determined, the land promoter and local planning authority (LPA) will negotiate a Section 106 agreement to capture the maximum contributions that can viably be afforded by a given project. The USA calls these what they really are – “impact fees” – given they should be payments to the local district to fund the additional infrastructure required to support the impact of a specific development. They should not be the solution to historic underinvestment in local infrastructure.
In negotiating the Section 106, both sides are aiming for the deemed viable position as dictated by the BLV as should be determined by a Local Plan. As such, whilst there is no certainty that the BLV will be the value with planning permission, it stands to reason that it should be a land promoter’s best estimate of what it might be. After all, if the project is forecast to produce more value than the BLV the LPA can reasonably demand greater contributions (for example through greater affordable housing) and if the project is forecast to produce less than the BLV the land promoter can reasonably demand less contributions. If both sides are well advised and are aiming for a viable position as determined by the BLV then the most likely outcome is that the value with planning permission will be the BLV. In this note we will assume that the value of development land with planning permission and the BLV are one and the same.
Actors and activities in land development
It is a long-held view that viability should be considered at a project level and that a development project can be considered viable if it provides a competitive return for a developer. There is a problem with this view and it is one that is brought into sharp focus when considering larger, often more complex developments. The problem is that there are distinct activities performed by different actors in the process of moving land along the value chain from bare non-permissioned land to become a completed development.
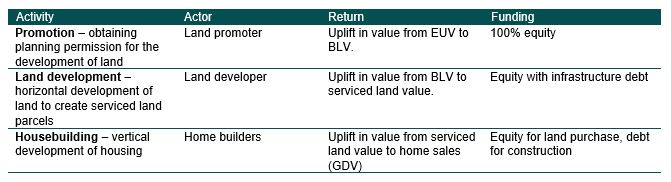
We believe there are three activities in the value chain of producing a completed development and there are therefore three actors performing three commercial enterprises at each of the three stages. As with all commercial enterprises these activities have their own risk and reward dynamics and need to be considered in isolation.
Each stage depends on the previous stage and the next thereby ensuring that all parts of the chain are therefore inextricably linked. The housebuilding function requires land as one of its key raw materials. If the promotion or land development activities provide an insufficient financial return the supply of land will be restricted. But if any stage in the process breaks down, for example, if land development becomes an unprofitable process then the first and the last stage breakdown.
Each activity requires a financial return that justifies the cost and risk taken by investors. If the returns are there the market thrives, if they are insufficient the market collapses.
It is right to acknowledge that one actor may perform multiple activities within one project. Home builders have historically participated in land promotion and land developing in order to secure their supply of land, particularly on smaller sites; however, irrespective of scale these are activities in their own right and require their own return on investment.
Equally, one activity may be performed by multiple actors. Whilst the land promoter may be one actor (eg. a landowner self-promoting its own land), it could be two or more actors (eg. a landowner, a promoter and a promoter’s investors).
Focussing in on the actors within land promotion, it is often considered that a landowner is not taking risk within a promotion agreement; however, this is not the case. For example, promotion agreements deduct planning costs from the sale of the land with planning permission and then share the land receipt between the promoter and the landowner. Under a promotion agreement a landowner is therefore exposed to the risk of higher planning costs, from planning delays and from falling values just as a promoter is. As such, a landowner’s risk profile is intertwined with a promoter’s and they are both participating in the same activity: promotion. How the returns are shared will respond to each party’s risk appetite and this will be subject to a contractual relationship between those parties which is frankly their business. The important thing is that, taken as one, the returns available to the activity of promotion justify the risk of the activity. For this reason, we will consider landowners and promoters as one ‘land promoter’, such as a self-promoting landowner. Indeed, to avoid confusion we will assume that each activity in the value chain is undertaken by one entity; a land promoter, a land developer and a home builder.
Promotion
Promotion is the activity undertaken by a land promoter. The commercial enterprise conducted by a land promoter is to invest land and cash to obtain planning permission. Their return stems from the uplift in land from its existing use value (EUV) to the BLV. Cash or equity is necessary to fund planning as banks will not lend for promotion work given its inherent risks and because the cost of promotion tends to exceed the value of the land without planning permission, its EUV.
Placing cash at risk on an uncertain binary outcome is a high risk activity and it is common for land promoters to raise funds from investors that can spread their risk across multiple projects. This manages the risk to a degree but given the hit and miss nature of this portfolio approach the land promoters require the successful sites to cover the sunk costs of the unsuccessful ones. The costs of promotion can be significant and over long periods.
In our experience, the cost for promoting new settlements typically varies between £7 million and £20 million. It is rare for costs to be less than £25,000 per gross acre, and common for costs to reach £40,000 per gross acre. These costs exceed the value of agricultural land such that the capital placed at risk exceeds the fall-back position of the EUV and the decision to self-promote therefore is a decision that ‘risks everything’. Given that it is a cash investment, this risk cannot be underestimated.
In terms of the time taken, Lichfields Start to Finish 3 estimates that sites of over 2,000 homes take on average 6.7 years from the validation of the first application to the completion of the first dwelling. This misses the extensive period to obtain an allocation for development. Taking Welborne Garden Village as an example that was proposed by the Local Authority (and therefore presented an ‘open door’ to the land promoter), it will still have taken 18 years from inception to the first completion.
It is fundamentally wrong to think about BLV as the price that convinces landowners to sell land, even if some highly distinguished commentators and the NPPF describe it in this way.
- The Harman report stated it “should represent the value at which a typical willing landowner is likely to release land for development, before payment of taxes.”
- The NPPF reinforces this view stating that the BLV “should reflect the minimum return at which it is considered a reasonable landowner would be willing to sell their land.”
Describing the BLV in this way gives the wrong impression that all of the value uplift flows to the landowner. This is patently not the case under any promotion agreement or option agreement. Furthermore, describing it as a means to convince a landowner to release land for development misses the fact that promotion is a commercial activity that requires a return to justify the capital outlay and risks taken. Promotion is not a passive activity as is evident by the significant cost of planning applications.
In our experience, land promoters require approximately a 5x return on investment if they are to be convinced to invest in promotion. Assuming a promotion cost of £25,000 per gross acre and an EUV of £10,000 per gross acre, this requires a BLV that is set at approximately 20x EUV. We consider this a minimum and below this level we would expect that promotion activity would slow significantly as it has over recent years. In simple terms, if the returns do not justify the cost and risk then actors will not make the investment.
Land development
It is essential that we do not lose sight of the next activity in the chain of developing houses. Land development follows successful promotion and is the activity of ‘servicing’ land for development. This requires a significant up-front investment in infrastructure before land can be sold to home builders at ‘serviced land values’.
The business model for a land developer is to buy land with planning permission (considered equal to the BLV and also referred to as the ‘unserviced land value’), invest in the horizontal infrastructure to service the land and then sell it at serviced land values.
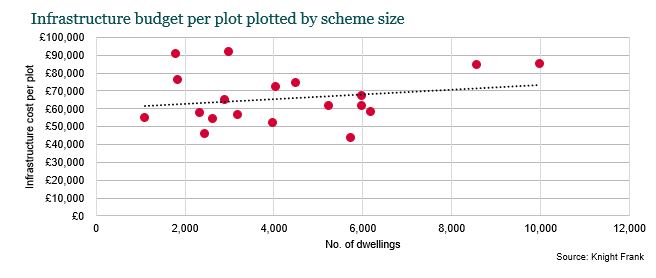
The investment in infrastructure can be significant and in our experience of new settlements typically ranges between £40,000 per plot to £100,000 per plot. This equates to an average of £63,000 per plot or £2.2 million per hectare of developable land (assuming 35 dwellings per hectare). The chart below illustrates the infrastructure cost budget for 19 projects that we have experience of, plotted by scheme size.
This reality of the infrastructure cost burden is often misunderstood by policy papers. For example ‘Gathering the Windfall’ by the Centre for Progressive Policy assumed an infrastructure cost of £130,000 per hectare (or £3,700 per plot) based on the strength of a 2012 CIL study for Newark and Sherwood Council . I will let you be the judge but that does not strike me as sound evidence to be drawing conclusions on national policy.
Furthermore, the VOA 2015 opinion of residential value with planning assumed that each site had no infrastructure costs which in turn caused politicians and policymakers to vastly exaggerate the uplift in land value with planning. For example, in the House of Commons report on Land Value Capture , commenting on the size of the average uplift in land values subsequent to the granting of planning permission, Councillor Tett from the Local Government Association said, “To find it is quite such a large uplift even surprised me, but that was a Government statistic, so it must be correct”.
Could it be the case that the narrative around unearned value uplifts from planning permission are founded on poor or misinterpreted data? I think so, and I think it is this misunderstanding that has led policymakers to believe that there is a surplus that might be ‘taxed’ via enhanced affordable housing. It is abundantly clear from my experience that this is not the case; sites can rarely support policy compliant affordable housing and any proposal to increase the requirements to 50% will stymie the passage of all but a very few sites into development.
Returning to the fundamental point of viability. Land development as an activity needs to be fundable if land is to be serviced prior to home building. In order to be fundable, the land developer must have sufficient land value as collateral for an infrastructure loan. This land value and the BLV are one and the same as previously discussed and so it becomes essential that BLV is set at a level that gives land development sufficient security for loan. What level is sufficient?
Not all of the £63,000 per plot (the average cited above) is required up-front as serviced land can be sold to recoup some of the investment. There is a peak debt position that needs to be funded. In our experience the peak debt requirements for new settlements typically exceed 12,500 per plot, even if this is the notional cap proposed by Homes England’s Brownfield Infrastructure and Land Fund. The loan may not exceed 60% loan to value and so the project becomes unfundable unless the land value with planning (the BLV) achieves a requisite threshold. In our experience this needs to be at least 20x the EUV (see case study below). If this threshold is not met the site will be unfundable and may stall or be mothballed.
This explains why the BLV level is as fundamental to the viability of land development as it is to promotion.
The value chain
Within this note we have described a value chain through the three activities. These can be illustrated on a chart as below, which uses figures taken from a garden village project. The values increase through the chain and justify each activity:
i. Promotion realises the uplift from EUV to BLV
ii. Land development realises the uplift from BLV to a serviced land value
iii. Home building realises the uplift from serviced land value to GDV
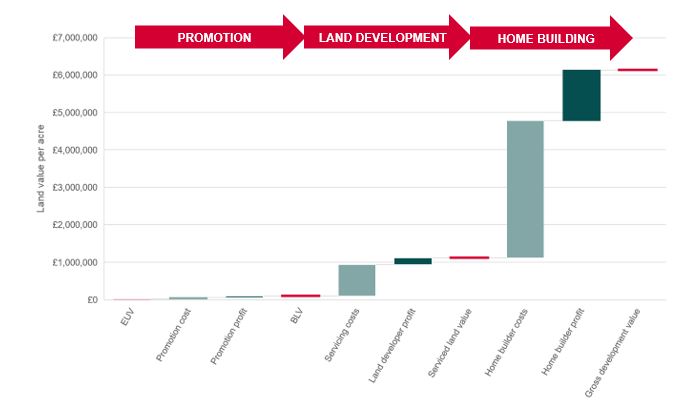
In this value chain the BLV is fixed by the Local Plan. It is fixed at a level (we hope) that justifies the promotion activity and enables land development to be fundable. And because it is fixed, it ensures that improving viability in home building or land development does not flow back to the landowner. In fact, the residual item in this part of the value chain to the right of the BLV (referring to the chart) is the contributions made through the s106 agreement into, for example, affordable housing.
Where the BLV is set is critical in providing a return for promotion and for funding land development. If set too low the supply of development land will cease and home building will lose one of its key raw materials.
Each profit bar illustrated in dark green (promotion, land developer and home builder profit) varies in nominal amounts per acre, but each is commensurate to the capital outlay and risks taken by each activity. As one example of this, it is typical for investors in land development to target internal rate of returns of 15%, but these are challenging to achieve and require a long-term commitment of resource and a long-term investment in place to be successful. The timeframes are dictated by absorption rates, which average 144 dwellings per annum in large sites of over 2,000 homes and are typically slower outside of the South East. Continuing with the example of Welborne, a project of 6,000 homes, it could therefore require 42 years in delivery following an 18 year promotion period. These are generational timeframes completely out of kilter with the usual funding cycles which require specific recognition in policy.
Case study
There is much mistrust in the sector, born out of years of viability assessments where LPA’s assume the land promoter is manipulating their numbers. In my experience it is usually the other way around; I witness land promoters doing their level best to show numbers that appear viable when their best assessments in fact show an unviable position. That said I acknowledge the mistrust in the sector and so the best thing to do is to refer to a real world case study.
I have selected a project which is now well underway. Planning permission was granted, infrastructure delivered, serviced parcels sold and homes built and sold. This case study allows us to compare the financials that justified the initial investment in promotion and land development, but also to reflect on the current financials now that the numbers have become known.
In both cases (estimated and actual) we have illustrated the financials on a net and gross hectare and acre basis as these are often confused with each other. The difference between net and gross can be significant, particularly on garden village sites where the public open space and biodiversity requirements can cause the net area to fall to approximately 35% of the gross area. By contrast the VOA study of residential land values assumes that the net developable land area is 80% of the gross area.
Estimated financials:
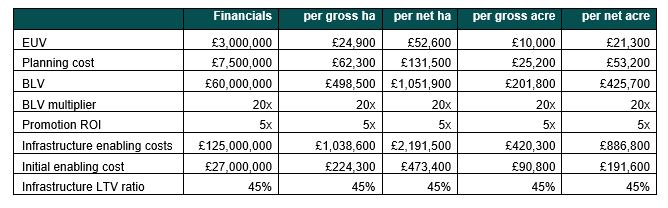
As can be seen in the table, the promotion activity was estimated to require cash of £7.5 million which was justified on a forecast return on investment of 5x. This required a BLV that would be a 20x uplift on EUV which was deemed achievable.
The proposed land development activity that would follow had a total forecast infrastructure enabling cost of £125 million; however, not all of this would be required up-front. An initial peak debt of £27 million was estimated given the amount required to unlock the first parcels of land which could then recover some of the capital outlay. Given a 60% loan-to-value ratio limit it was felt that the infrastructure could be funded within usual banking covenants.
It is of note that that estimated planning costs represented a significantly higher sum than the EUV. Also, that the estimated infrastructure cost was £2.2 million per net hectare (not £130k per hectare as estimated by ‘Gathering the Windfall’ ).
Actual financials:
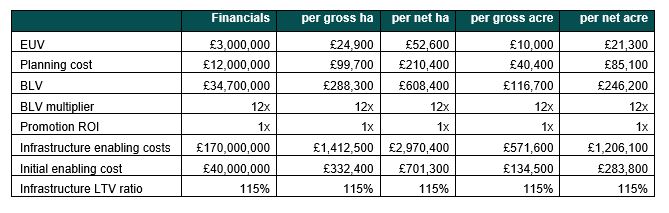
The reality of the project presents a more challenging set of financials.
The actual cost of promotion grew to £12 million given the time taken (14 years from inception to first completion) and the changing planning landscape. As one example of this change, the Local Authority declared a climate emergency during the promotion process and in doing so justified standards that go substantially further than were anticipated. Over 95% of the population of Britain now lives in an area covered by a climate emergency declaration .
Once planning had been granted and the Section 106 signed the site was valued for infrastructure debt purposes at £34.7 million. This confirmed that the land promoter’s return on investment had in fact only been 1.3x and was insufficient to justify the cost, risks and significant time taken.
In the meantime, the cost of infrastructure had risen significantly and the servicing cost budget swelled to £170 million (£2.97 million per net hectare). This led to the LTV ratio increasing above the allowable threshold such that the infrastructure has become unfundable through conventional means.
Even if the infrastructure cost had not increased and had instead remained at the forecast £125 million with an initial £27 million, the LTV ratio would have increased to over 60% and become unfundable.
This is one of many examples of development projects that are currently facing severe viability challenges and are at risk of being mothballed.
This also illustrates what happens when the BLV on a project falls below 20x EUV. The two activities that produce land for home building (promotion and land development) become uncommercial and unviable.
The example also illustrates the risks associated with promotion and land development. It is these risks that require commensurate returns if private sector investors are be attracted to promotion and land development.
Site specifics
Throughout this note we have highlighted a number of areas where the specific attributes of a site can have a significant impact on its viability. The impact of these differences are perhaps best illustrated by taking hypothetical examples from two ends of the spectrum:
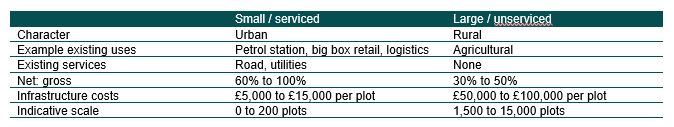
Whilst these examples are the extremes, every development site in-between is different, has different infrastructure requirements and can achieve different values.
Whereas urban infill sites will typically have the benefit of pre-existing services and infrastructure, greenfield unserviced sites will need to provide their own infrastructure at a significant cost which will weigh heavily on their viability and their ability to support policy compliant affordable housing.
Greenbelt sites may fall anywhere in this range. We have experience of some sites which benefit from pre-existing infrastructure and others that have none and will struggle to support policy compliant affordable housing requirements.
Some of the most significant differences result from differences to the value of the existing use or suitable alternative uses. As an example of this dynamic it has been interesting that Greater London Authority (GLA) sites earmarked for residential development have remained undeveloped or moved into alternative uses since the Mayor announced a minimum of 50% affordable housing across its land holdings. The fixed threshold caused the value of residential development to fall below existing or suitable alternative non-residential uses. Therefore, whilst the policy intended to increase the delivery of affordable housing in London, it instead served to dramatically reduce the quantum delivered.
The impact of suitable alternative uses will be no different in greenbelt sites and greenfield land, where development land may (subject to approval) switch to other uses such as logistics.
These differences mean that every site is different and can support differing levels of affordable housing and other Section 106 contributions. This also makes a one-size fits all affordable housing percentage unworkable.
We strongly recommend that the existing system of assessing the viability of each individual site is continued. The experience of the GLA serves as a warning of the unintended consequences if fixed affordable housing thresholds are introduced as a ‘golden rule’ or otherwise: the passage of land into residential development will freeze up and the quantum of affordable housing will fall overall.
For more information relating to Development Partnerships, please follow this link: https://www.knightfrank.co.uk/development-partnerships