Your Leading Indicators | Sterling | Interest Rate Outlook | Signs of Systemic Stress
Discover key economic and financial metrics, and what to look out for in the week ahead.
2 minutes to read
Here we look at the leading indicators in the world of economics. Download the dashboard for in-depth analysis into commodities, trade, equities and more.
Sterling reverses back to pre-’mini budget levels’
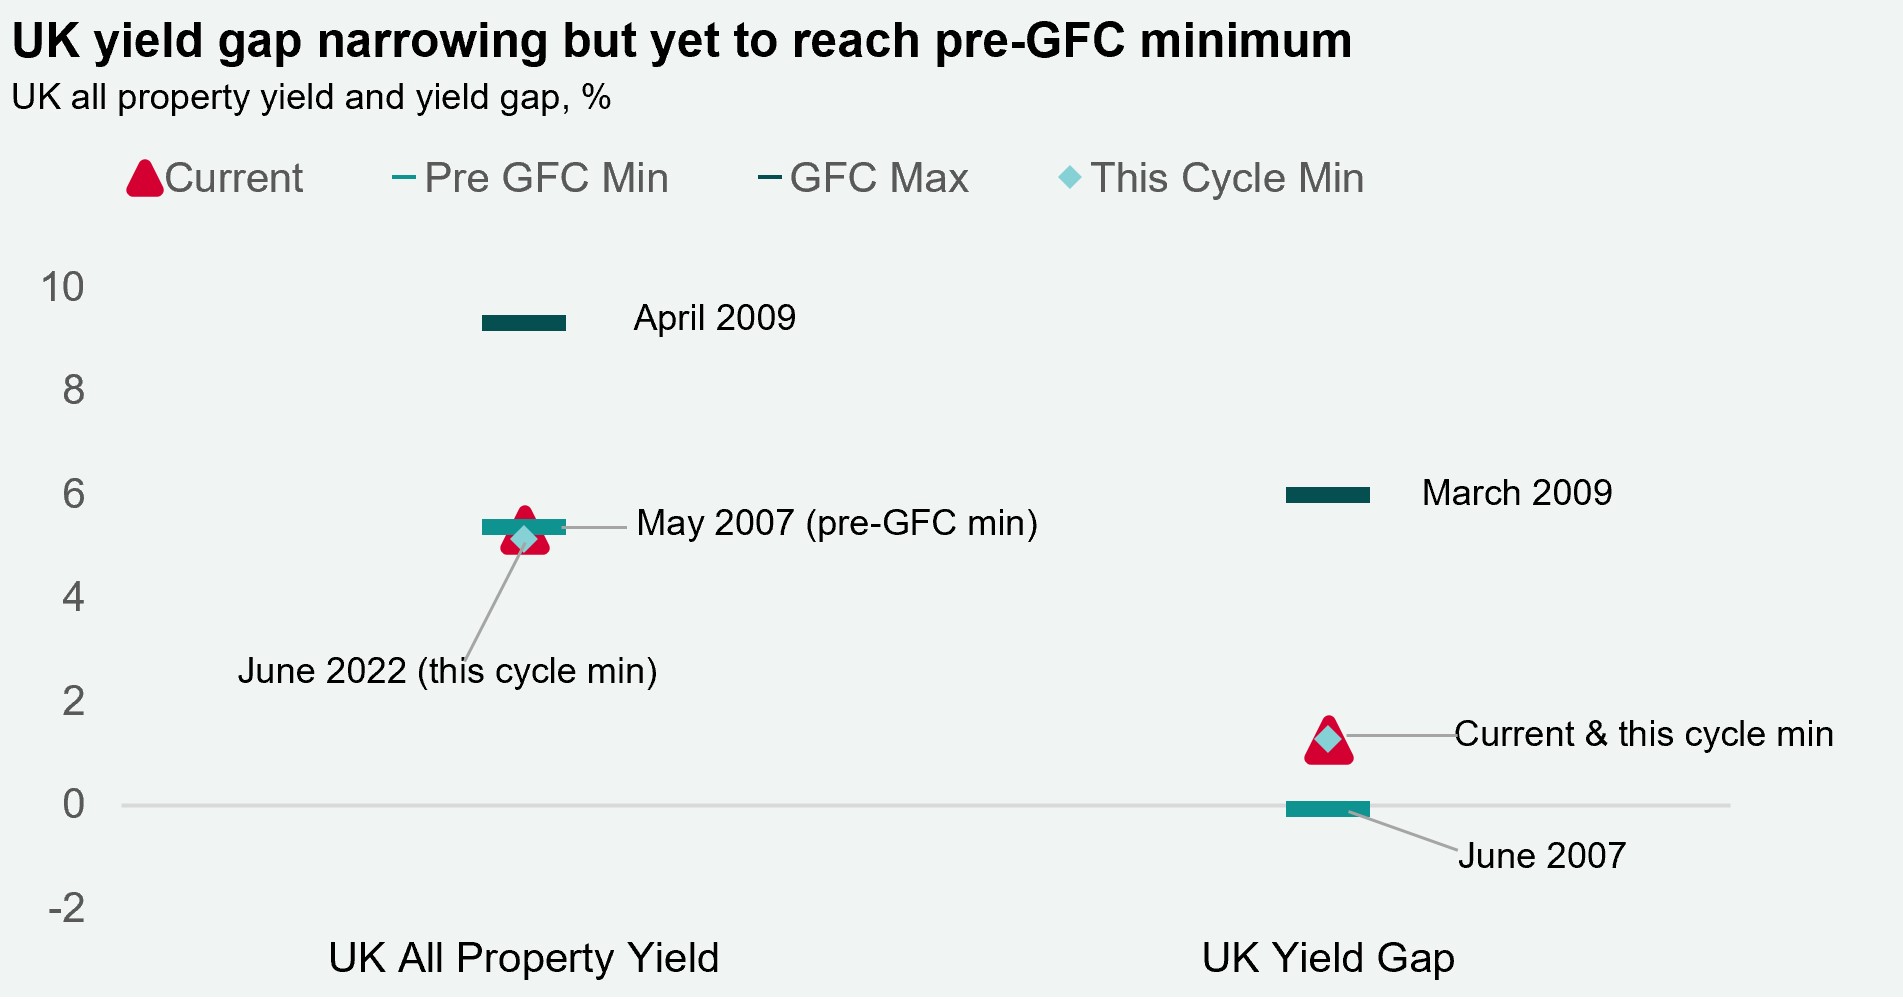
Sterling has appreciated from a record low of $1.03 last week, back to $1.14, last seen two weeks ago. However, sterling is set to remain sensitive for now. The risk free rate has also seen improvement, with the UK 10-year gilt yield down from 4.60% following the policy announcement, to 3.87% currently. The yield gap between the UK All Property yield and the 10-year gilt yield is currently 1.26%. However, in the run up to the GFC, the yield gap hit a low of -0.7%. UK 30-year gilts peaked at 5.08% last week and have since compressed to 3.89%. This follows an announcement by the Bank of England (BoE) that it would start £65 billion of new quantitative easing over a two week period for 20+ year maturities. 5-year SONIA swap rates also hit their highest level on record at 5.4% last Tuesday, an increase of +127bps over the week. Since then, 5-year swaps have moderated by 70bps to 4.7%.
What is the outlook?
The UK base rate is now forecast to average 5.0% in 2023, before moderating to 3.25% by Q4 2024, according to Capital Economics. Money market expectations for base rates for 2023 have come in over the week from an expectation of rates peaking at 6+% next year to below 5.5% currently.
Signs of elevated systemic stress across the Euro area & UK
The Russia/Ukraine crisis, damage to the Nordstream 1 and 2 pipelines and market volatility in the UK following the UK's mini-budget announcement last week led to a regional increase in the ECB's new composite indicator of systemic stress (New CISS). The Euro area New CISS is currently the highest since March 2020 (0.61) and the UK's stress indicator reached the highest level since April 2009 (0.56), albeit markedly lower than the GFC peak of 0.93 and pandemic peak of 0.70. US levels remain relatively low at 0.26.
Download the latest dashboard