Wave after wave – mixed signals are here to stay
Gold hits its highest level and more government stimulus is on the horizon, whilst economic data seems to surprise on the up and downside – below we lay out the latest musings of the global economy
3 minutes to read
The mixed messages from different parts of the world with regards to the success (or otherwise) of coronavirus containment measures is confusing. Recently we have seen surging case numbers in India and the US with potential and confirmed second and third waves in areas of Australia, Spain and in Hong Kong. The continuing threat casts doubt over the longevity of the economic rebound.
However, the flipside has been promising results from vaccine trials and renewed government support with the EU 750 billion-euro ($877 billion) Covid-19 rescue fund and a proposed $1trn of support in the US.
The economic effects of new and continuing outbreaks will depend on the specific characteristics and the ability of governments to contain them and support economies without imposing widespread restrictions.
Investors have increasingly sought safe-haven assets as a result. Gold has come within touching distance of $2,000 – its highest level ever recorded. Interestingly, as the US grapples with Covid cases the dollar’s safe-haven status has come under strain, falling around 5% in the past month and hitting a two-year low. The Euro, in contrast, hit a six-year high this week. The buying power of cross-border investors will be shifting.
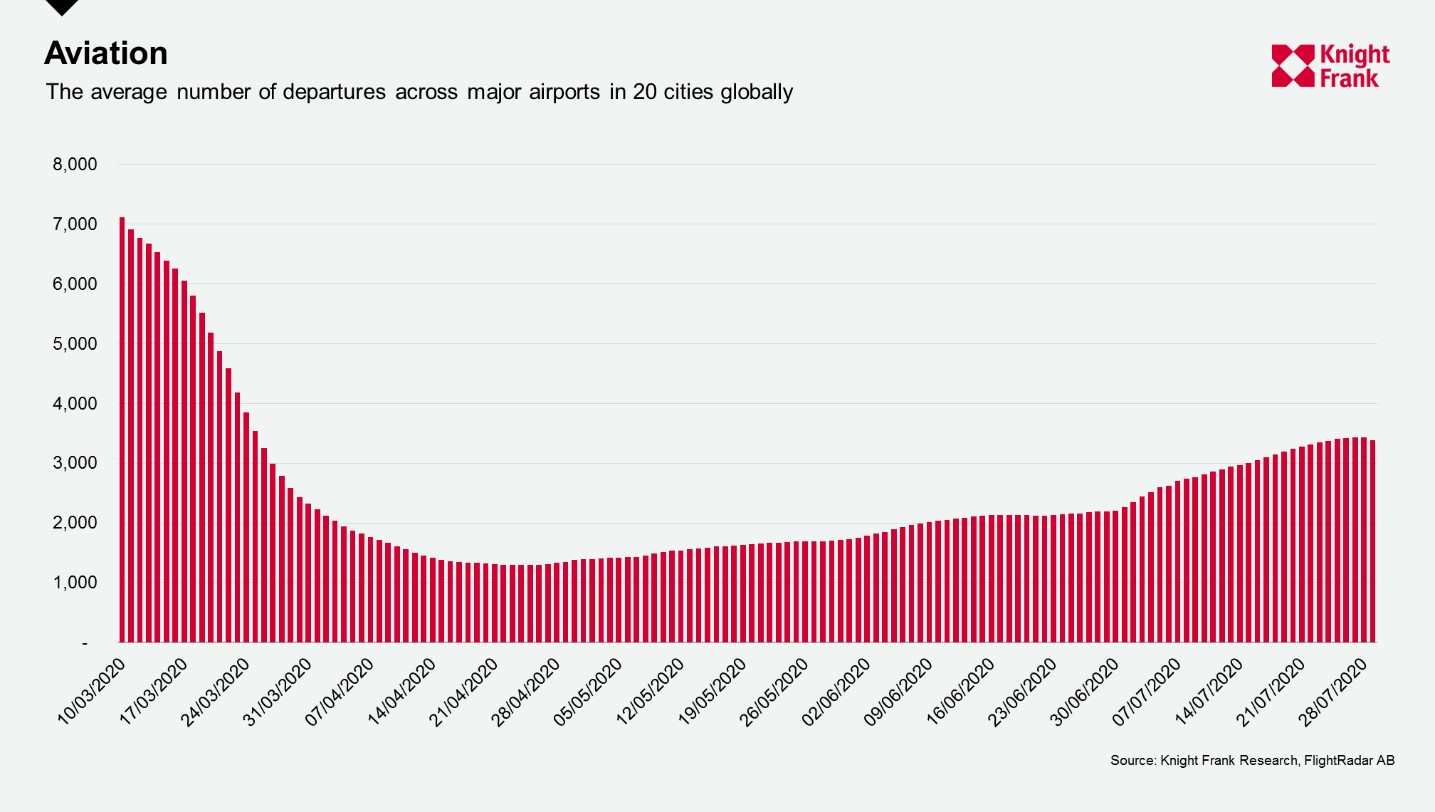
Let us fly
Travel continues to be disrupted, especially for countries where cases are high or rising. At the beginning of 2020, a US passport would gain visa-free access to 185 countries – now less than 30 allow US citizens in, with many requiring testing, and some reviewing their policies with the Bahamas recently banning all US flights.
Despite this, air travel is seeing an uptick across global cities. Departures from the 20 cities we track have risen by 150% from the trough in April, though they still remain 50% lower than in mid-March.
Many commentators say it will be at least three years before the aviation industry recovers fully - much of this is due to changing attitudes and an unwillingness to travel. An industry-commissioned survey of 4,700 air travellers found that 65% said their biggest concern was sitting next to someone who might be infected, whilst 37% said they were worried about breathing the air in the plane.
What data is best?
During the pandemic we have turned to real-time indicators which have been useful in showing the direction of activity and attitudes. Many of these, such as the Google mobility monitor, flight data and TomTom traffic index have shown improvements, yet they also point to the immediate impact of a renewed spike in cases. For example, in Hong Kong where cases have risen recently, the average morning traffic congestion had fallen to 20% last week, from 28% a week earlier and 47% a month ago.
However, these do not show the full extent or quantify the economic impact, for that many rely on quarterly GDP estimates despite their backwards looking nature.
The ONS may have found a solution. The Business Impact of Coronavirus Survey (BICS) is conducted fortnightly with results released just 10 days later. According to Capital Economics, the survey, which asks 25,000 businesses about their financial performance, accurately captured the large dip in activity April and small monthly increase in May.
We will be able to see the accuracy of this new measure as well as the real-time indicators as more second quarter GDP data gets released. We have had a glimpse this week with Hong Kong, Germany and the US second quarter estimates.
Hong Kong’s economy shrank by 9% annually, following a fall of 9.1% in the first quarter. Germany saw a 10.1% quarterly and an 11.7% annual contraction, and in the US real GDP fell by a record 32.9% on an annualised basis.
As more of the impact is demonstrated in the second quarter figures we may be able to look to these other indicators for guidance on how the rebound is shaping up.