Global City Economic Watch Tuesday 2nd June
As large-scale quarantine measures begin to be lifted globally, we are providing a weekly glance at different real-time indicators to assess the level of economic activity in cities and understand how much closer to ‘normality’ they are.
3 minutes to read
In this week’s edition we look at different indicators within Google’s COVID-19 Community Mobility Report* on a city-by-city basis and provide an update on the latest flight activity.
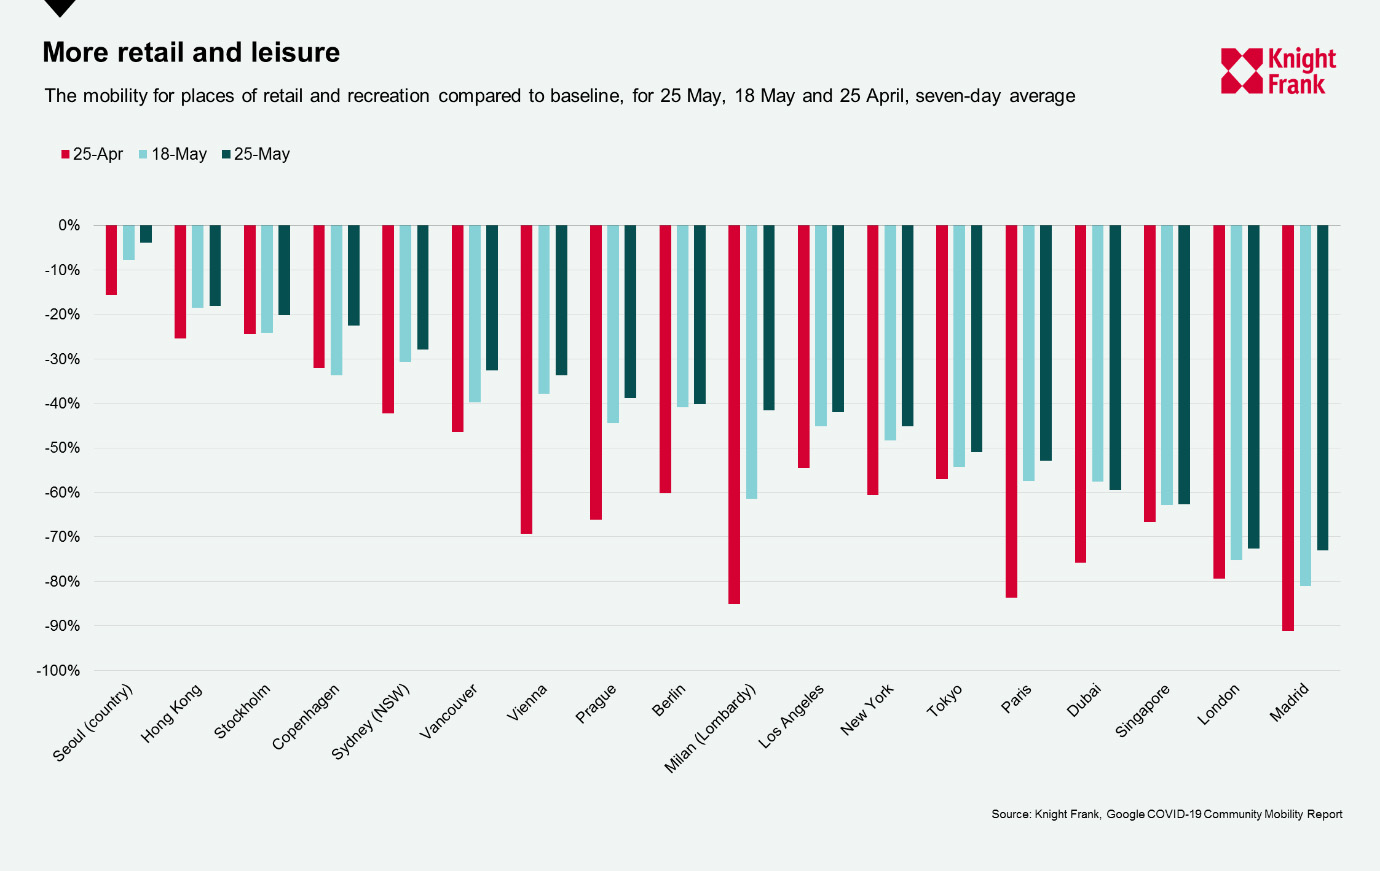
Google’s COVID-19 Community Mobility Report analyses how visits and the time spent at different places have changed compared to a baseline. Here we look at how the mobility for places of retail and recreation have changed for the week ending 25 May compared to a week and a month earlier.
There are positive signs of recovery globally, but the pace is slow. All of the 18 locations we’re tracking saw an increase in visits and time spent at places of retail and recreation in the past month. The highest increase in mobility was recorded in Milan (the Lombardy region), where mobility went from 85% below the baseline in the week ending 25 April to 42% below the baseline more recently. Vienna and Paris also saw their mobility jump by more than 30% over the past month – now sitting at 34% and 53% below the baseline respectively.
All cities, except for Dubai, saw their retail and leisure mobility stay the same or increase in the week ending 25 May compared to a week earlier. The largest weekly changes were again in Milan (the Lombardy region) jumping 20%, Copenhagen which sits 23% below its baseline and Madrid, which at 73% below baseline still has some way to go.
Only three cities sit within 20% of their baselines with Seoul, Hong Kong and Stockholm, all of which avoided full scale lockdowns, at 4%, 18% and 20% below their respective baselines.
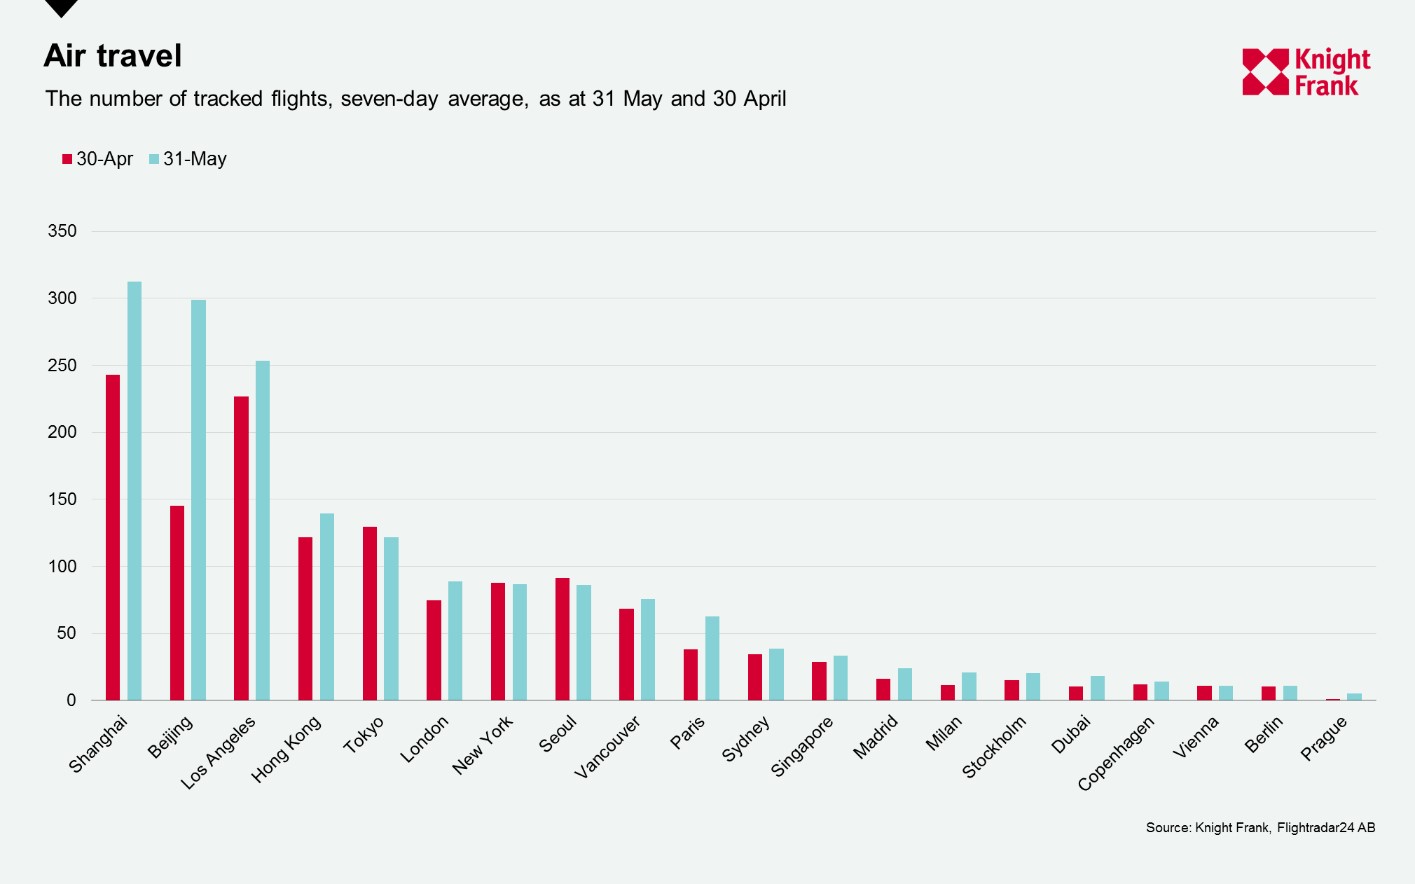
Air travel has all but ground to a standstill in may places as populations stay at home. There are tentative signs for recovery as more countries move to relax entry restrictions and airlines look to ramp up their scheduled flights once more. Whilst many say it will be years before we return to pre-Covid levels there has been a noticeable uptick in most locations we track over the past month.
In 16 of the 20 locations there has been an increase in activity from 30 April to 31 May, the exception being Tokyo, Seoul and New York which have seen flights decline by 8, 5 and 1 flights, on average, respectively.
Beijing and Shanghai, unsurprisingly, have seen their flight departures rise by the most, with 154 and 69 more flights respectively, especially as domestic tourism increases. Los Angeles and Paris saw their departures rise by over 20 to a seven-day average of 253 and 63 respectively – however, putting this in perspective, the first seven days of March saw an average of 889 and 577 tracked flights at each of these locations.
Next week we revisit population mobility through the Citymapper Mobility Index and TomTom Traffic Index as well as the level of restaurant bookings as economies begin to emerge from lockdown and restaurants offer limited seated capacity.
Notes on methodology
*Google’s COVID-19 Community Mobility Report analyses the how visits and time spent at different places change compared to a baseline. The baseline is the median value, for the corresponding day of the week, during the 5- week period Jan 3–Feb 6, 2020