UK Property Market Outlook: 23 August 2021
How dramatic has the impact of the pandemic really been on the UK property market?
3 minutes to read
The pandemic has not upended the UK housing market.
As the stamp duty holiday winds down and the impact of Covid fades, an analysis of property prices since March 2020 indicates subtle rather than transformative change.
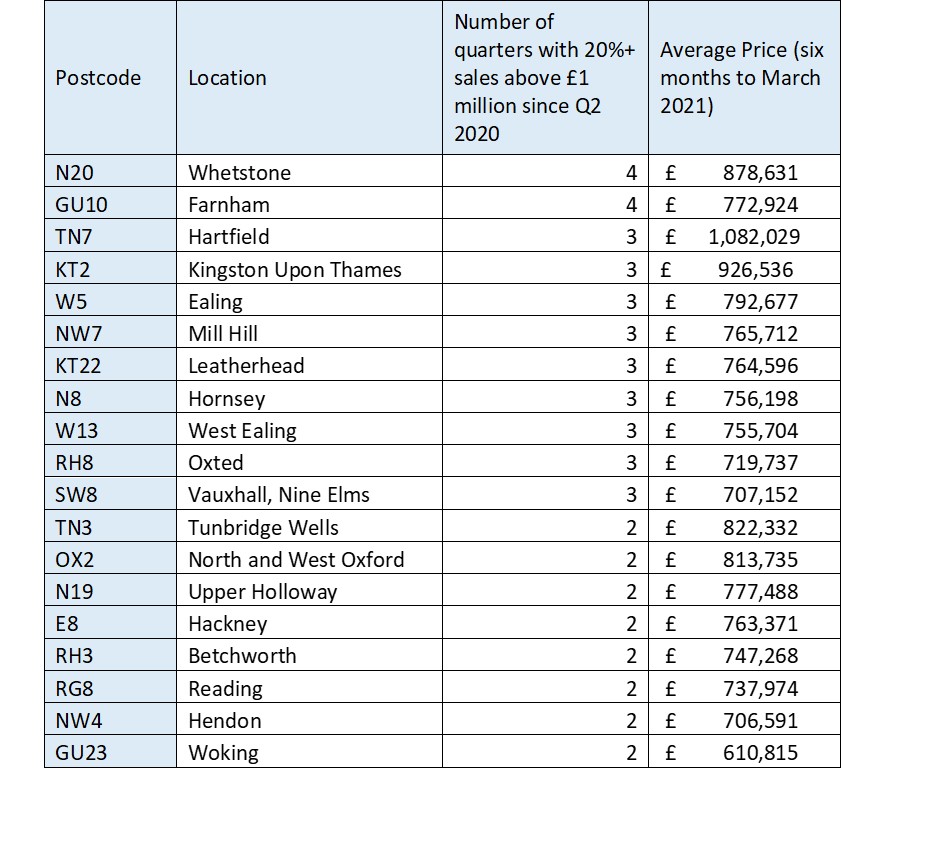
For example, 19 locations in England and Wales have qualified as £1 million property markets since March 2020, and none of them are in the Cotswolds.
The list has a distinctly suburban flavour but is dominated by London and the south-east.
To qualify as a new £1 million market, at least 20% of sales had to be above that threshold in two or more quarters since Q2 2020. This cannot have happened in any quarter between Q1 2019 and Q1 2020.
New £1m neighbourhoods since the pandemic

The inclusion of Hackney (E8), Ealing (W5) and Vauxhall (SW8) would not have surprised many before Covid. The areas have benefitted as price growth rippled outwards from central London, propelled by large infrastructure projects in the case of Vauxhall and Ealing.
However, more than half the list is outside the London postal district. It is topped by Whetstone (N20) and Farnham (GU10), followed by Kingston Upon Thames (KT2) and Hartfield (TN7). Outside the capital, new £1 million markets include North and West Oxford (OX2), Tunbridge Wells (TN3) and Reading (RG8).
It underlines the growing demand for space and greenery following successive lockdowns. While the creation of new £1 million property markets has rippled outwards from central London, Covid means a number of urban areas will have been leapfrogged.
“The pandemic has left its mark on the UK property market by magnifying existing trends rather than re-writing the rulebook,” said Tom Bill, head of UK residential research at Knight Frank. “Things won’t pick up from where they left off in March 2020 but the wider trajectory will feel familiar.”
Another example of this relates to price growth.
Newquay in Cornwall saw the largest increase (+22%) in the year to March 2021, followed by Ryde on the Isle of Wight (+19%). The top five, which is based on repeat sales data, is completed by Chapeltown in Leeds (+19%), Lymington in the New Forest (+18), and St Austell in Cornwall (+17%).
The common thread is the distance from London, highlighting the game of catch-up the rest of the country is playing with the capital in terms of house prices.
However, this process was underway before the pandemic due to growing affordability pressures in London.
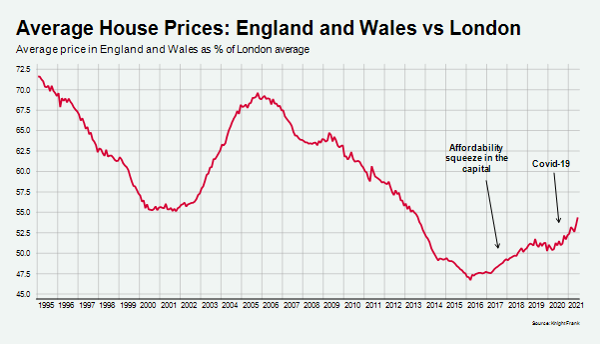
The average house price in England and Wales was 47% of the London equivalent in March 2016, the lowest ratio since Land Registry records began in 1995. It has been rising since and stood at 54% in June this year due to stronger demand and price growth outside of the capital.
To put that into perspective, there is still some way to go before it reaches the same ratio seen in the years before the global financial crisis, when the figure peaked at 70% in October 2005.
As the chart below shows, the pandemic exaggerated a change that was already underway.

The gap is likely to narrow further. Average London prices in June this year were 71% above their pre-global financial crisis peak in November 2007. For the whole of England and Wales, the figure was 46%, showing the greater scope for future growth.
The return of international buyers will temper this and we expect price growth in prime central London to outperform the rest of the country in 2022. Furthermore, if the gap narrows too far, demand in London will accelerate.
However, the direction of travel is clear. Covid has left its imprint on the UK property market but there will also be something quite recognisable about what comes next.
Photo by Mark Timberlake on Unsplash