UK Property Market Outlook: 10 May 2021
There is a shortage of supply across UK property markets, but it is more notable in some areas than others
3 minutes to read
There wasn’t the customary post-Christmas bounce in property listings in the UK this year.
Instead, rising uncertainty over new Covid-19 variants, the logistical constraints of home-schooling and an expectation that the March stamp duty deadline would be missed all contributed to a slowdown in supply.
The number of new properties listed for sale in England and Wales was 15% lower in March this year than the same month in 2020, OnTheMarket data shows.
As a result, there is upwards pressure on prices as supply has struggled to keep pace with demand.
More balance should return in coming months and the number of market valuation appraisals, which are a leading indicator of supply, is on the rise, as we analyse here.
In the meantime, a closer analysis of listings data over the last year shows that supply is tighter in some parts of the country than others.
The ratio between the number of properties under offer and those available for sale in England and Wales has grown over the course of the pandemic, OnTheMarket data shows.
The total number of properties under offer in March 2020 was 211,000. The ratio between this figure and the 307,000 properties that were available for sale was 0.7. In other words, there were 0.7 properties under offer for every property available to buy.
By April this year, as demand strengthened and supply slipped, the ratio was 1.2, with 260,000 properties under offer compared to 210,000 available for sale. In other words, the group of properties under offer was bigger than the group of properties available to buy.
Properties that were listed for sale at the start of the month and went under offer later in the same month were counted in both groups.
However, there were differences across the UK regions.
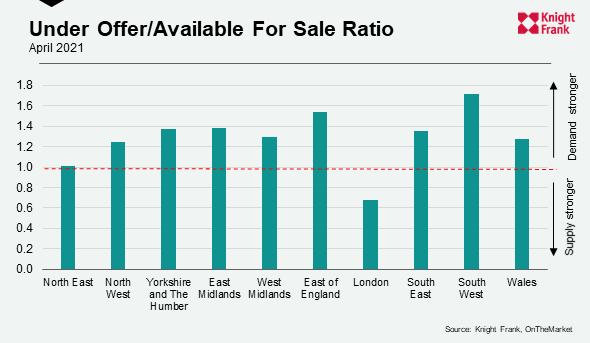
The ratio was 0.7 in London in April this year, which was the lowest of all the regions, marginally up from 0.6 in March 2020. It was also the only region where the number of properties under offer in April was lower than the total available to buy, as the below chart shows.

London, which has a high proportion of flats has not benefited in the same way as other regions from growing demand for outdoor space and greenery. The fact supply hasn’t fallen versus demand to the extent it has in other parts of the country also reflects ongoing affordability constraints in the capital.
Meanwhile, the highest ratio was in South-West England, where the number of properties under offer was 1.7 times greater than the number of properties available for sale in April this year.
“The regional discrepancies in supply show this is a pandemic-related issue rather than anything deep-seated,” said Tom Bill, head of UK residential research at Knight Frank. “The property market will undergo a period of adjustment as supply and demand normalise, which means the second half of this year is unlikely to bear much resemblance to the first half.”
Although London doesn’t face the same supply squeeze as other regions, houses with outdoor space in prime markets are in short supply.
The shortage is particularly acute in the rental market due to the fact owners are capitalising on the strength of the sales market.
It has left tenants looking for houses in areas like Chelsea and Notting Hill “almost bereft of options” according to David Mumby, head of prime central London lettings at Knight Frank.
Photo by Bruno Martins on Unsplash