Six years on, where saw the strongest house price growth post Brexit?
House price growth rises across the European Union, but how has the UK fared compared to its European counterparts?
2 minutes to read
June 23rd marks the sixth anniversary of the Brexit referendum, when the Leave campaign shocked Westminster by winning 52% of the vote, triggering the resignation of David Cameron the next day.
Putting to one side this divisive period in British politics, how have the UK and Europe’s housing markets fared in the intervening six years? We crunched the numbers to find out.
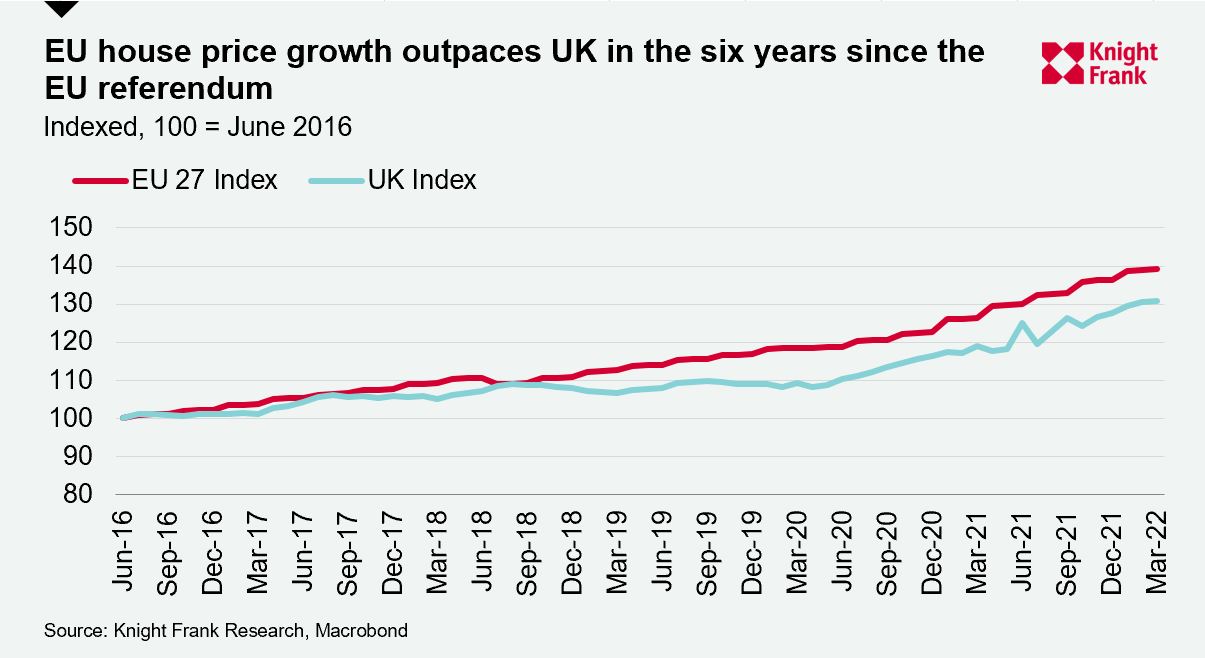
House prices are up 39.3% across the EU-27 with almost half the rate of growth occurring in the last two years during the pandemic. The UK’s rate of growth isn’t far behind with prices up 30.8% over the six-year period.
While UK investors will look enviously at the European Union’s outperformance – first time buyers in the UK may take some solace from the UK’s more relaxed pace of growth since Brexit.

The EU-27 average conceals a bigger story. Twelve of the 27 markets have witnessed price growth in excess of 50% since 2016, Germany, Ireland and Portugal amongst them.
A prolonged period of low interest rates, significant fiscal stimulus across the region during the Covid-19 crisis which led to accumulated savings and limited new supply, exacerbated by the pandemic has seen prices climb.
A look at the top-performing countries since the Brexit vote in June 2016 reveals Central Europe is on top with Hungary, Slovakia and the Czech Republic each registering price growth above 90%.

As monetary policy tightens, the rate of growth across the UK and the EU is expected to slow.
Italy, Spain and Greece have recorded some of the lowest rates of price growth in the last six years and the higher cost of finance may see price growth in these markets fall into negative territory.
With the EU expected to be slower to increase interest rates – the first hike slated to be in July – and the US and UK amongst the fastest there may be a currency play for some overseas buyers looking to take advantage of a weaker euro.
Discover more
Knight Frank’s Global House Price Index tracks the movement in residential prices across 56 countries and territories worldwide, view the latest edition here or sign up here to receive your copy each quarter.
Photo by Tomek Baginski on Unsplash