Development opportunity: Identifying gaps in market supply
Although availability has marginally increased in recent months, the vacancy rate for the south east has
remained below long-term trends.
2 minutes to read
As a result, the question of a supply crunch continues to be raised, with the answer increasingly less clear given the changing focus of the occupier and inflationary cost pressure on future build projects. At the time of writing, any conclusion has been deferred by a demand-side that continues to be impacted by both geopolitics and Covid-19. But given the changing dynamics of the market, some key south east locations are presenting as an opportunity to respond to a lack of best quality space.
Fundamentally, businesses will be drawn to wherever quality space is available. Analysis of take-up over the past 10 years reveals that the instances of Grade B space being transacted has lessened over time, with new or Grade A deals accounting for 88% of take-up in 2021.
But not all Grade A space is created equal. Occupiers are increasingly digging deeper into the attributes of the building and the surrounding location to fulfil business objectives such as sustainability and, importantly, employee expectations. It is unsurprising therefore that occupiers are willing to consider moving from their existing locations in search of the right space.
To understand where development opportunity exists, we have created a heat map indicative of these competing forces. Our research team have analysed current and future market factors, including occupiers’ preferred building attributes, market growth potential and future supply to identify where gaps may arise in the short and medium term.
The methodology
Our bespoke M25 Development Opportunities map pinpoints hotspots where there is potential to develop office space based on:
- Quality of current supply, such as amenity provision within the building envelope and the wider location.
- The strength and potential delivery timings of development pipeline, inclusive of schemes under construction and those with the potential to start within the next 12 months.
- Rental growth prospects.
To gauge strength of current amenity, we focused on 20 unique datasets, collating more than 600 data points across our 18 key markets. This included assessing quality of available building stock (building age, time since last renovation, BREEAM), amenity provision (roof terraces, shower facilities, education spaces, car charging points), as well as connectivity (walkability, digital connectivity). Oxford, Brighton, Croydon, Wimbledon and Cambridge are predicted to be the most active development markets in the short term due to the strength of demand, supply profile and rental growth prospects. Meanwhile, Woking, Heathrow and Slough are considered balanced markets, meaning the supply profile meets expected future demand. Guildford, Watford and Reading are examples of “ones to watch”.
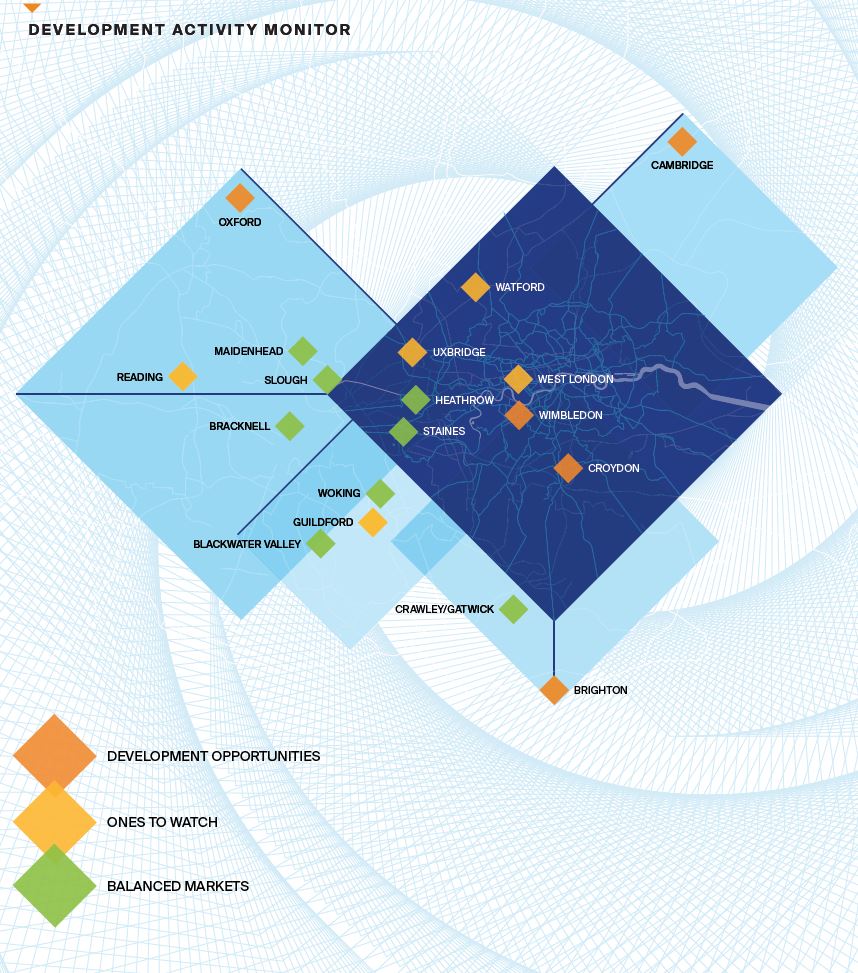
Click to enlarge image
By understanding the granular aspects of supply and balancing these with occupational preference, investors and developers can gain a rounded view of potential opportunities in the south east marketplace.
Download Navigating the property lifecycle PDF