Where will we need additional last-mile logistics space? Which are the most in-demand markets?
To answer these questions, we have produced a model assessing the distribution of household online spend, across the UK. Combining data on income, retail spend, and demographic profile to determine online retail spend.
4 minutes to read
Retailers and operators will seek facilities that can service these "hotspot" locations for online consumer demand.
What factors determine hotspots of online spend?
Population density
Areas with high population density offer a clear opportunity, with more chimney pots within close proximity, delivery routes can be shorter, with more stops and lower costs per delivery compared with deliveries in more rural areas. Across Greater London, there are 5,700 people per square kilometre but fewer than 50 people per square kilometre in the most rural local authorities of the UK. The most densely populated areas of London have more than 10,000 people per square kilometre.
Household income
UK cities tend to have higher average household disposable incomes. Across the UK, households have an average of £51,600 per annum, while in London, the average is £74,300 per annum. As well as London, Cambridge, Oxford, Brighton and Hove, Southampton, and Northampton all have average household incomes above the UK average. So it is clear to see the opportunity that household consumption in these areas offers for retailers, and thus the logistics operators that service deliveries to these areas.
The list of top 15 local authorities for average earnings is dominated by local authorities in Greater London, several local authorities from the South East and Eastern region also feature. Local authorities that have high commuter flows into London, such as Brentwood, Chiltern and Elmbridge also feature.
Retail spend (propensity to consume)
The proportion of income a household spends on retail is largely determined by income level, but also the cost of living, and the composition of the household. Households on a lower income spend a larger proportion of it.
In locations where living costs are higher, households will have less disposable income available for retail spend. In cities with lower living costs (relative to wages), the proportion of household income spent on retail will be higher.
The structure of the household also impacts spending patterns, for example, a household comprised of a single adult will typically have lower retail spend compared with a couple with the same household income.
Online penetration rate
Age profile and household composition play a significant role in determining the proportion of retail spend that takes place online. Younger demographic groups tend to have higher online shopping propensities compared with shoppers. Urban areas typically have a younger demographic profile compared with more rural locations, and the lowest proportion of residents aged 70+. However, online penetration rates are growing rapidly amongst older shoppers. In the future, we expect age profiles to play less of a role in determining online spend.
Based on current shopping habits, population distribution, income levels, and demographics/household structure, we have determined hotspot locations for online retail spend, both within Greater London and the cities/areas outside of London.
So, where are the hotspots for online retail spend across the UK?
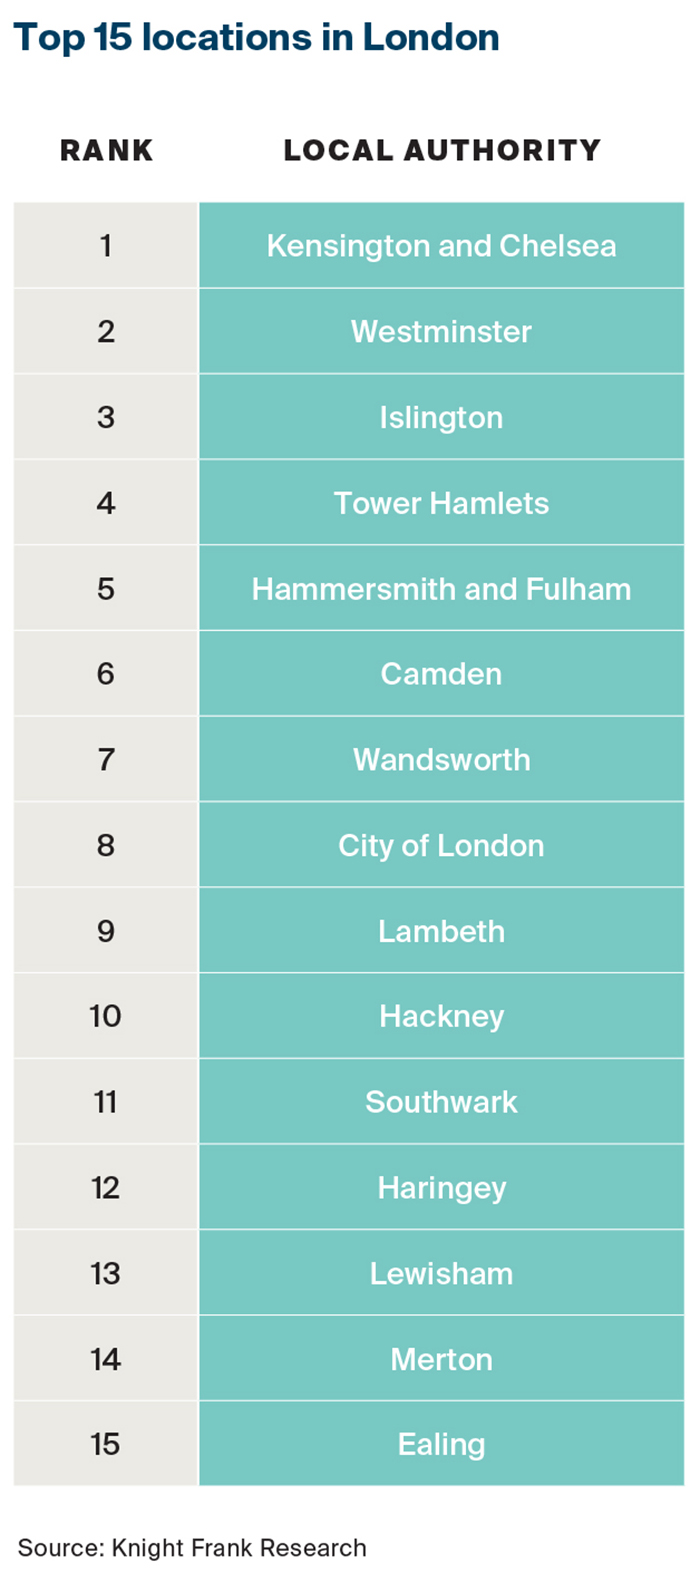
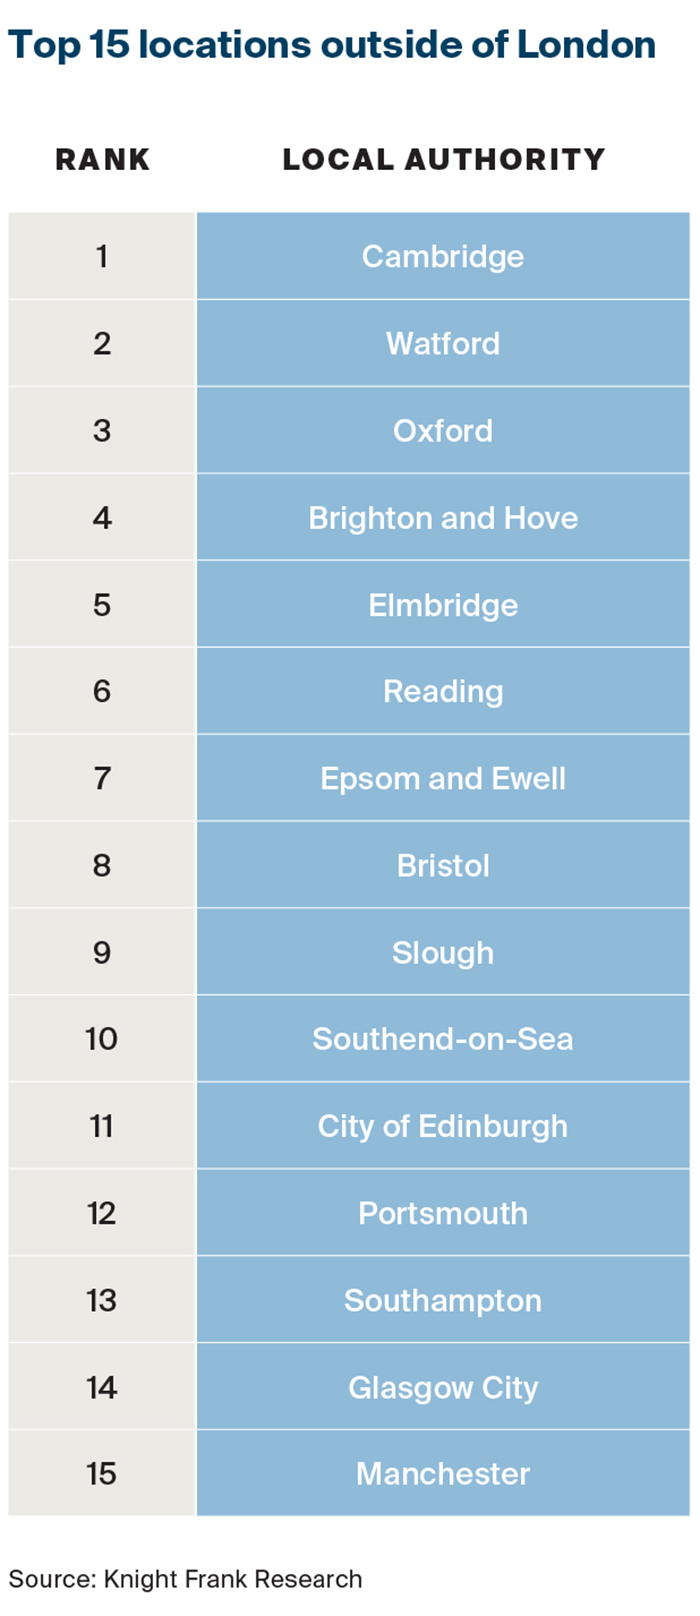
The locations in the tables below have been identified as hotspots for e-commerce. These locations are based on online spend per sq km.

Click image to enlarge

Click image to enlarge
Where are the biggest shortfalls in terms of stock?
The biggest shortfalls can be found in inner London boroughs. However, facilities servicing last-mile deliveries into these markets will often be located in neighbouring boroughs or less central locations. Westminster and Kensington, and Chelsea do not have sufficient stock to service demand.
How are things changing? What does this mean for urban logistics demand and fulfilment models?
Though urban populations continue to grow in the UK, the rate of growth is slowing. The areas with the highest rates of population growth from mid-2019 to mid-2020 were predominantly areas of London such as the City of London (12.5%), Camden (3.5%), and Westminster (3.3%). The areas that saw the greatest decrease in population were Lambeth (-1.3%), West Suffolk (-1.0%), and Inverclyde (-1.0%).
However, in 2020, more people left London for elsewhere in the UK than moved in. In the year to mid-2020, internal migration flows (within the UK) show more people arrived than departed in the East and South East in comparison with previous years; driven by people moving out of London. As higher income commuters move from London to the surrounding areas are likely to drive up demand for last-mile logistics to service these locations.
As well as changing populations and migratory influences. The profile of online shoppers is broadening, as a wider demographic takes to online shopping, demographic profiles will play less of a role in determining online penetration rates.
Based on our models forecast growth in online retail spend, the locations where we expect to see the largest rise in consumer demand over the next five years are the City of London, Elmbridge, Kensington and Chelsea, South Bucks, and Westminster.
This analysis aims to highlight areas of demand for last-mile fulfilment based only on consumer demand. Further analysis factoring in drive times to these populations, as well as current stock levels, development potential, and rental levels, could offer a fuller picture in terms of locations that could service this demand.
Download Future Gazing 2021