Question Time
The head of Knight Frank’s Analytics team is no stranger to curious questions. Ian McGuinness’s 23-strong team have helped hundreds of clients to answer seemingly impossible conundrums and make sound personal or commercial decisions. Here, he reflects on three of them, and unpacks how the Analytics team could help you too

Can you find my lost land?
While the UK’s Land Registry was founded in 1862, it won’t be a surprise that Knight Frank has clients which go back further than this.
Across large institutional and estate portfolios, we see a number of reasons why land becomes functionally ‘lost’. Land historically inherited may have created bureaucratic gaps along the way, and plots set aside for a particular purpose may have later fallen into disuse. The ‘ghosts’ of Victorian plot extents haunt the official register to this day – with the old houses they were based on long gone. Local assumptions can also creep into play about the purpose a particular plot serves. Ultimately, the conditions for adverse possession can arise, and with them, multi-million-pound risks.
We’ve developed a number of data-led techniques to pick up traces of these sites. Some of our spatial databases cover themes like the arrangement of land and buildings; others look at postal addresses and delivery points. Some record shapes and sizes, others are more like a phone book – with records pinned to particular points on the map, and of course, Land Registry digital data shows us the extent of all registered land.

We stitch chains of these databases together – in some cases based on common data identifiers and in others based on feature co-location. Tobler’s first rule of geography holds true in all our work: proximity determines relatedness. Unregistered parcels show up in the spaces between data joins: gaps where we expect to see data. By triangulating between them, we can establish extents, usage and ownership.
One national institutional client was so impressed with our work they put our findings back to the Land Registry to have land formally recognised and registered.
How far will people travel to doggy daycare?
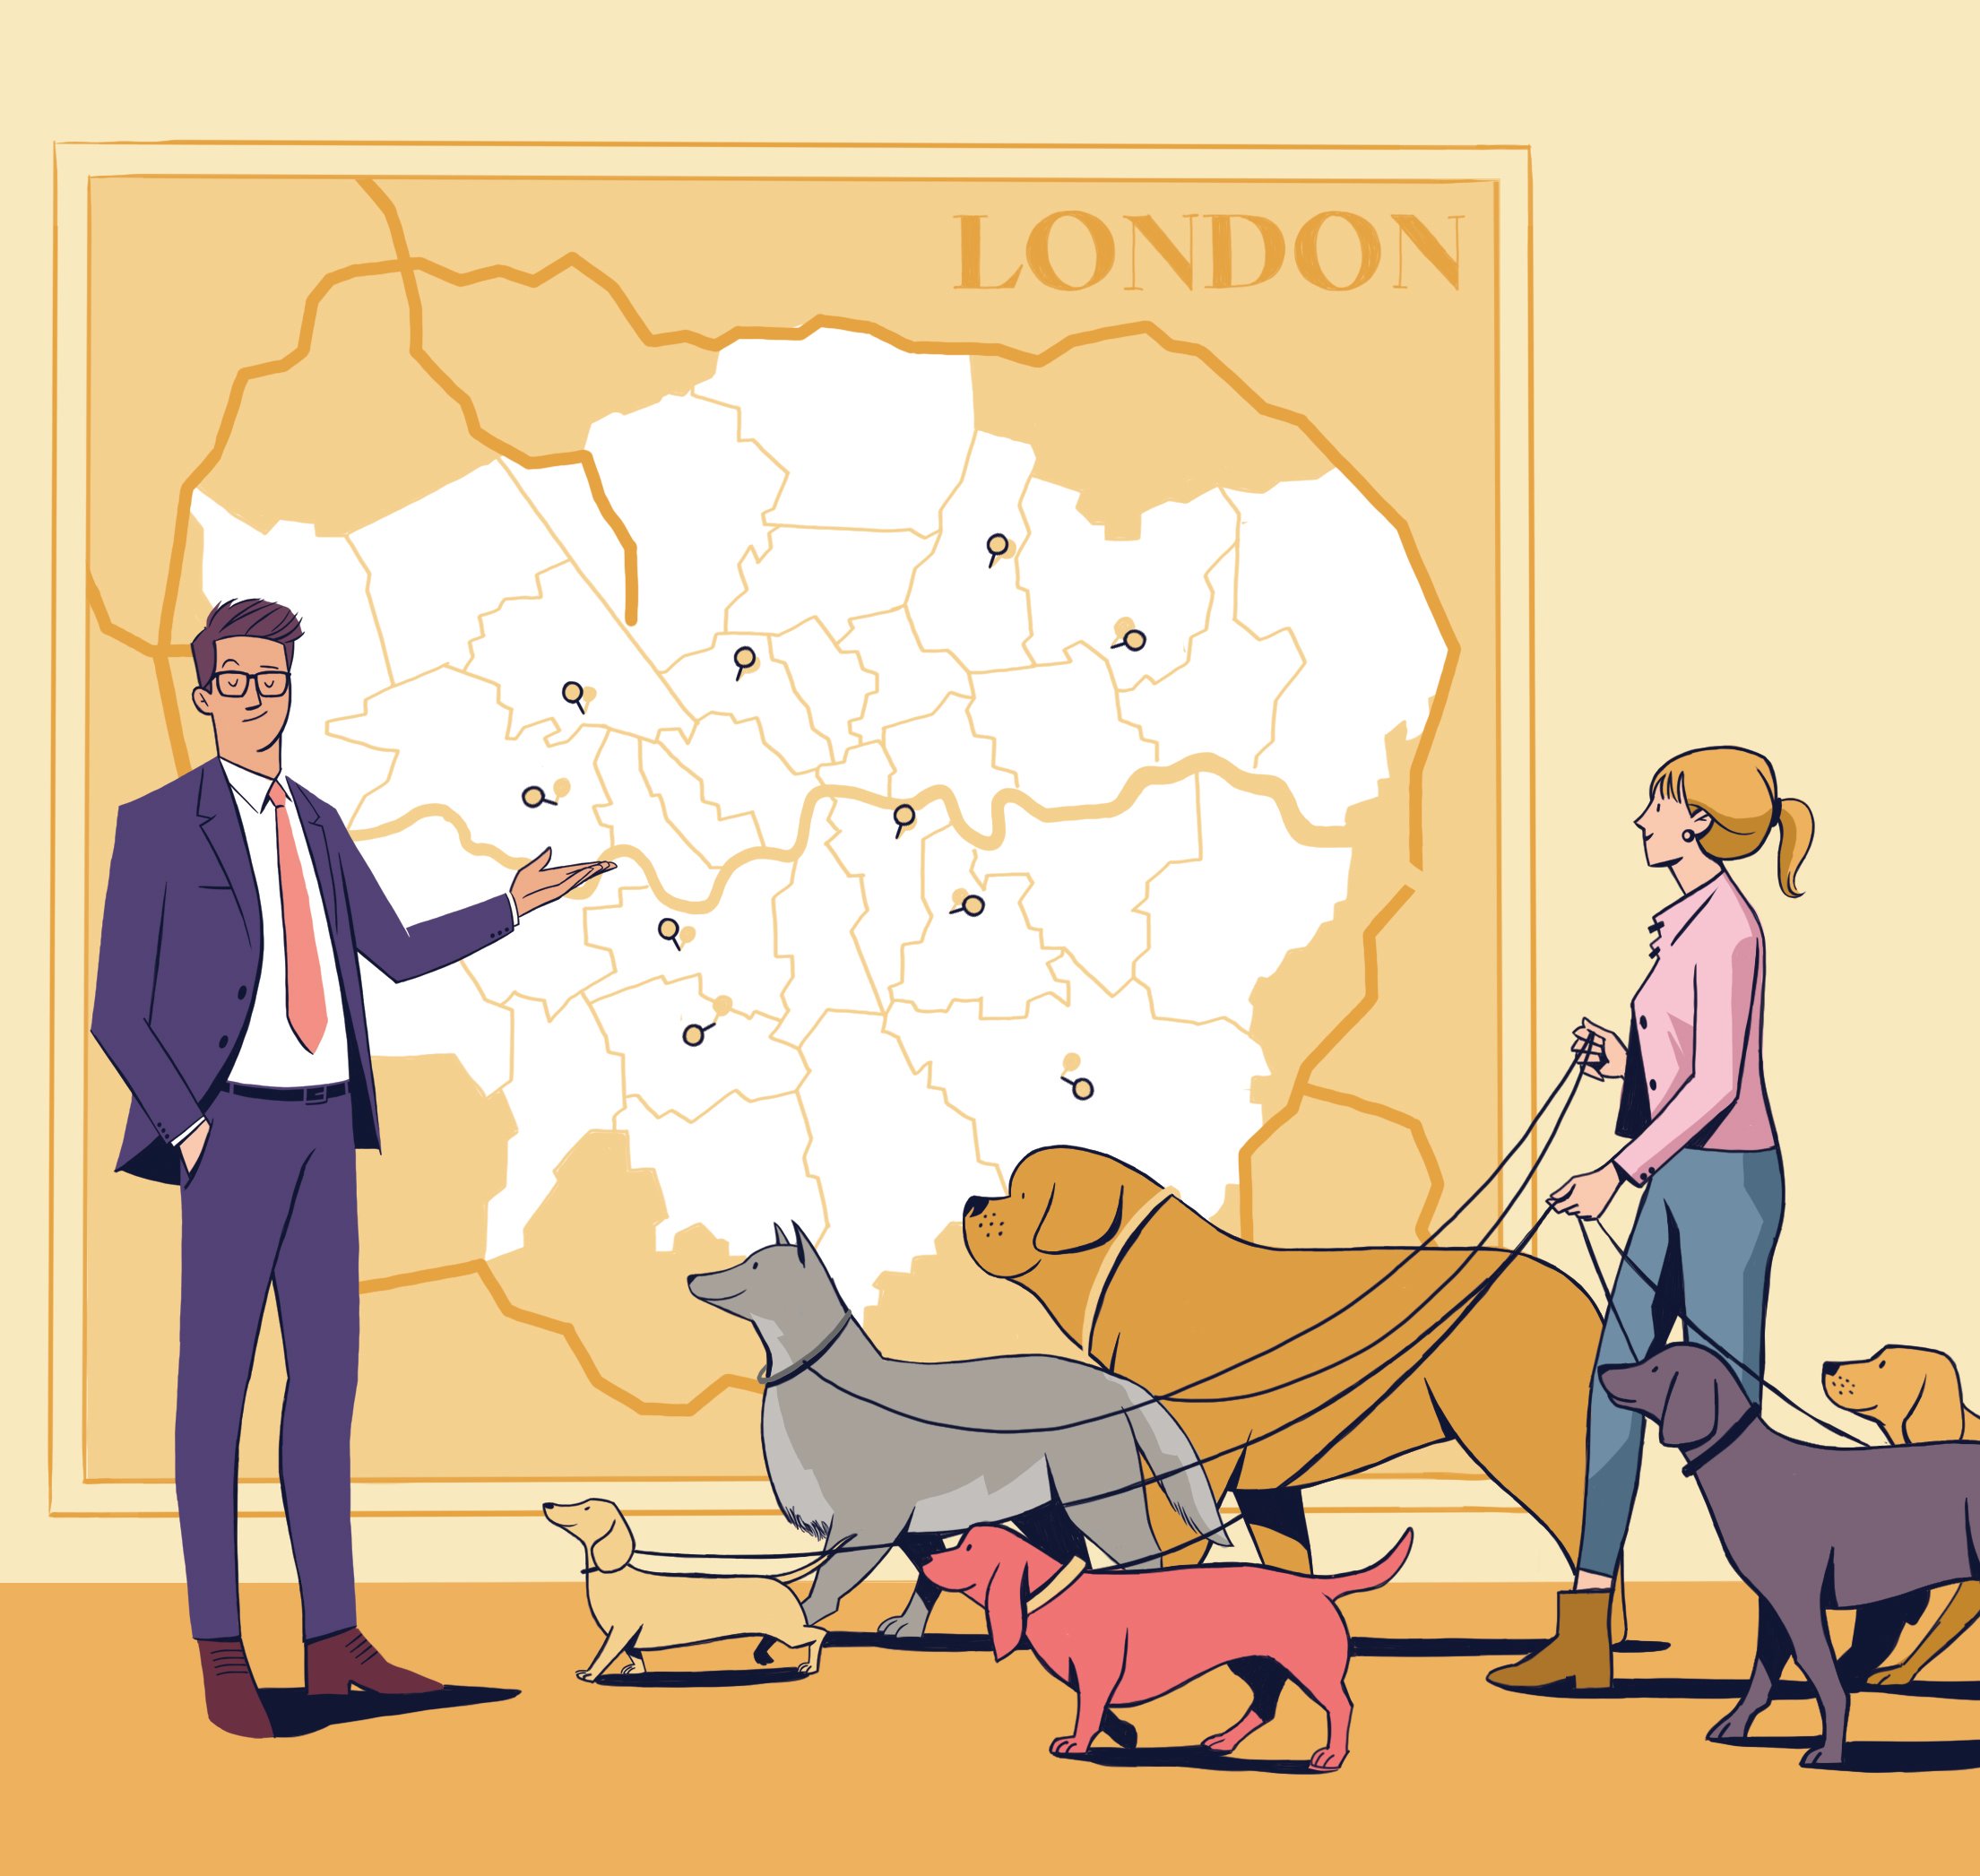
We’ve always been a nation of dog lovers, but recent years have seen an explosion in demand for dog daycare. Our canine best friends need exercise, socialisation and – unless you want your beloved pet to become a viral sensation via your Ring camera – supervision too. When Knight Frank was asked to help a dog daycare provider fetch some of the best locations to set up shop, the Analytics team added a few tips and tricks into the mix.
The brief called for us to target “affluent outdoorsy” people – but who are they? Demographic analysis played a key role in lighting up the relevant catchments. Our nation’s most dog-obsessed demographic are rural middle-class families who favour a traditional village lifestyle over proximity to cities. Elsewhere, high-achieving families living in outsized detached homes built from the 1980s onwards have (as we know from YouGov polling data) a similarly outsized interest in dogs.

These households are living fast-track lives focused on their advancing careers, finances and childrens’ development. Their spatial distribution pulls much closer to London, roughly comprising a band 35 minutes either side of the M25. Clipping access to this demographic to major roads allowed us to project rush hour travel conditions from a number of prospective sites for our client, with a modelled detour distance of 15 minutes each way.
Knight Frank has a large land footprint database of rural landowners, from which we could examine peripheral parcels greater than an acre in size. Sites previously in horticultural, agricultural or equestrian use were surfaced. Small clumps of existing outbuildings were a bonus. Maps of flood risk zones helped us to avoid sites that could easily throw up major operational problems.
Drawing on insights that fuse land availability, site characteristics and customer lifestyles means that our clients make the best possible commercial decisions. When it comes to identifying the right location, Knight Frank really is leading the pack.
Which side of Regent Street should I be on?
It’s a truism that location really is everything. London’s different retail centres offer hugely different trading conditions; some aim to curate an unexpected but absorbing experience based on casual footfall (think, for example, of an arcade boutique), others rely on the scale of passing traffic, whereas other retailers have the pulling power to draw you off grid to altogether quieter areas.
In all these cases, demographic data can tell us a great deal about consumer preferences and spending habits. Mobile phone companies, credit reference agencies and store card schemes are among the many data sources around which retail gravity models and store network optimisation can be developed.

Our clients often specify ideal brand adjacencies, even between seemingly unrelated categories, to help with this. These approaches allow a catchment footprint to be determined, and in a city like London, these footprints can be finely calibrated to within a few street blocks. Factors such as walkability play a large role in this, as does the permeability of the streetscape.
The simple act of crossing Regent Street transports you from one commercial ecosystem to another, with distinct business rates, brand clusters, amenities, experiences and rents. It’s just one of the city’s many socioeconomic borders, delineating the edge of bohemian Soho from the cultivated elegance of Mayfair. Our clients know that where they make their strategic selection of premises within this prime central London geography directly influences who will walk through their front door.
If you have a question for Ian’s team, please contact analytics@knightfrank.com